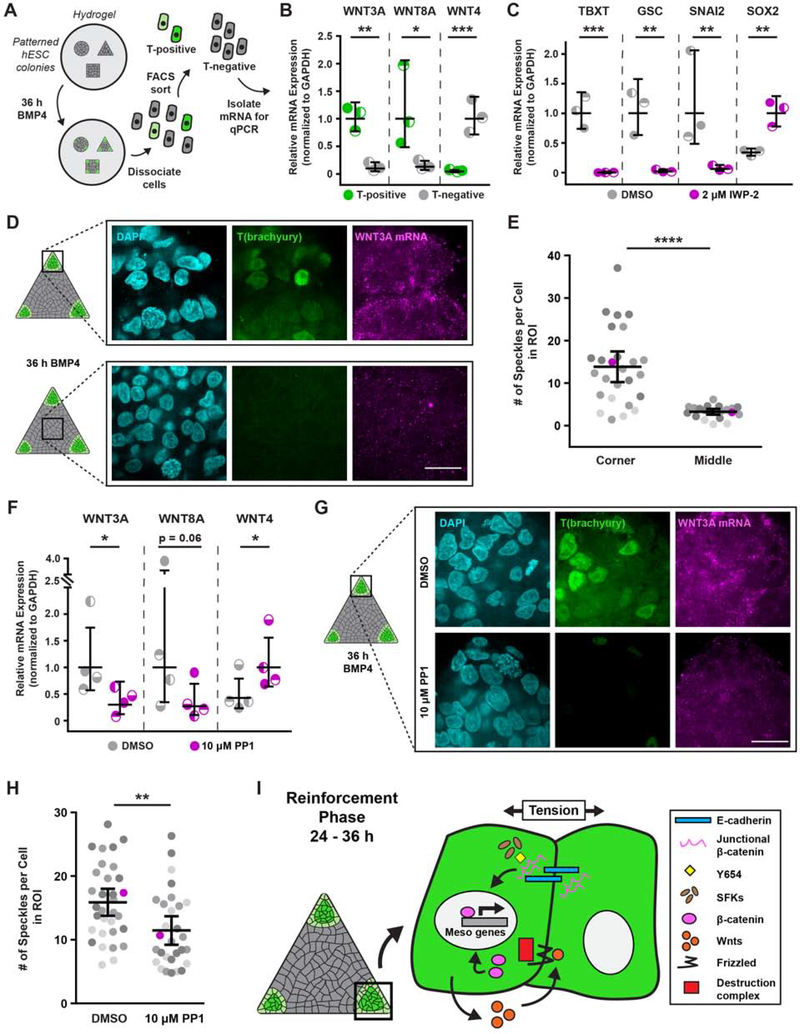
Figure 7: Wnt signaling reinforces mesoderm specification in regions of high tension.
(A) Cartoon of isolation protocol to compare Wnt ligand expression between T-positive and T-negative cells.
(B) Relative Wnt ligand expression levels in T-positive and T-negative hESCs after 36 h BMP4.
(C) Relative mesoderm gene expression levels after 36 h BMP4 plus vehicle (DMSO) or Wnt inhibitor (IWP-2; 2 μM).
(D) Representative images of T(brachyury) protein expression and in-situ-detected WNT3A mRNA in the corner and middle of triangle hESC colonies after 36 h BMP4.
(E) Plot of in-situ-detected WNT3A speckles in the corner and middle of hESC colonies after 36 h BMP4. Magenta data points correspond to images shown in (D). n = 26 (4, 12, 10) imaged corner ROIs and n = 20 (3, 8, 9) imaged middle ROIs.
(F) Relative Wnt ligand expression levels after 36 h BMP4 plus vehicle (DMSO) or Src inhibitor (PP1; 10 μM).
(G) Images of T(brachyury) protein expression and in-situ-detected WNT3A mRNA in the corners of triangle hESC colonies after 36 h BMP4 plus vehicle (DMSO; top) or Src inhibitor (PP1; 10 μM; bottom).
(H) Plot of in-situ-detected WNT3A speckles in the corners of triangle hESC colonies after 36 h BMP4 plus vehicle (DMSO) or Src inhibitor (PP1; 10 μM). Magenta data points correspond to images in (G). n = 26 (4, 12, 10) imaged ROIs from DMSO condition and n = 20 (3, 8, 9) imaged ROIs from PP1 condition.
(I) Cartoon summarizing the mechanism by which regions of high cell-adhesion tension direct mesoderm specification. The Src-mediated release of junctional β-catenin feeds forward and upregulates Wnt ligand expression to promote mesoderm specification.
For (B), (C), (E), (F), (H): Line and bars represent mean ± 95% CI. For (E), (H): Data from independent experiments represented by different shades of gray. Rectangles on colony cartoons indicate imaged regions. All scale bars = 20 μm. *p < 0.05, **p < 0.01, ***p < 0.001, and ****p < 0.0001.
See also Figure S7.

