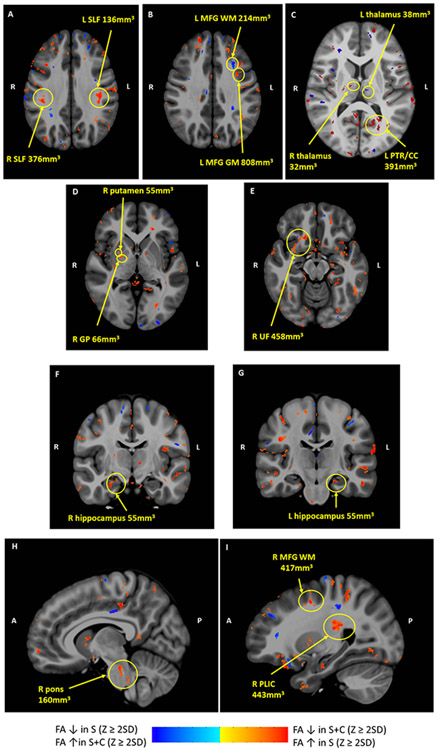
Figure 2. Areas of FA differences between patient groups in composite axial and sagittal diffusion tensor images.
Red clusters indicate areas where FA z scores were ≥ 2SD lower in the S+C group than the S group; blue clusters indicate where FA z scores were ≥ 2SD lower in the S group than the S+C group. R and L indicate Right and Left on axial images; A and P indicate Anterior and Posterior. Cluster size is noted for each structure. A FA in bilateral SLF higher in S than S+C; B FA in prefrontal WM lower in S than S+C, FA in prefrontal GM higher in S than S+C; C FA in R thalamus higher in S than S+C, FA in L thalamus lower in S than S+C, FA in L PTR/CC higher in S than S+C; D FA in R putamen and GP higher in S than S+C; E FA in R UF higher in S than S+C; F FA higher in R hippocampus in S than S+C G F FA higher in L hippocampus in S than S+C; H FA higher in R pons in S than S+C; I FA higher in R PLIC and prefrontal WM in S than S+C. Abbreviations: CC, corpus callosum; GM, gray matter; GP, globus pallidus, MFG, middle frontal gyrus; PLIC, posterior limb of internal capsule; PTR, posterior thalamic radiation; SLF, superior longitudinal fasciculus; UF, uncinate fasciculus; WM, white matter

