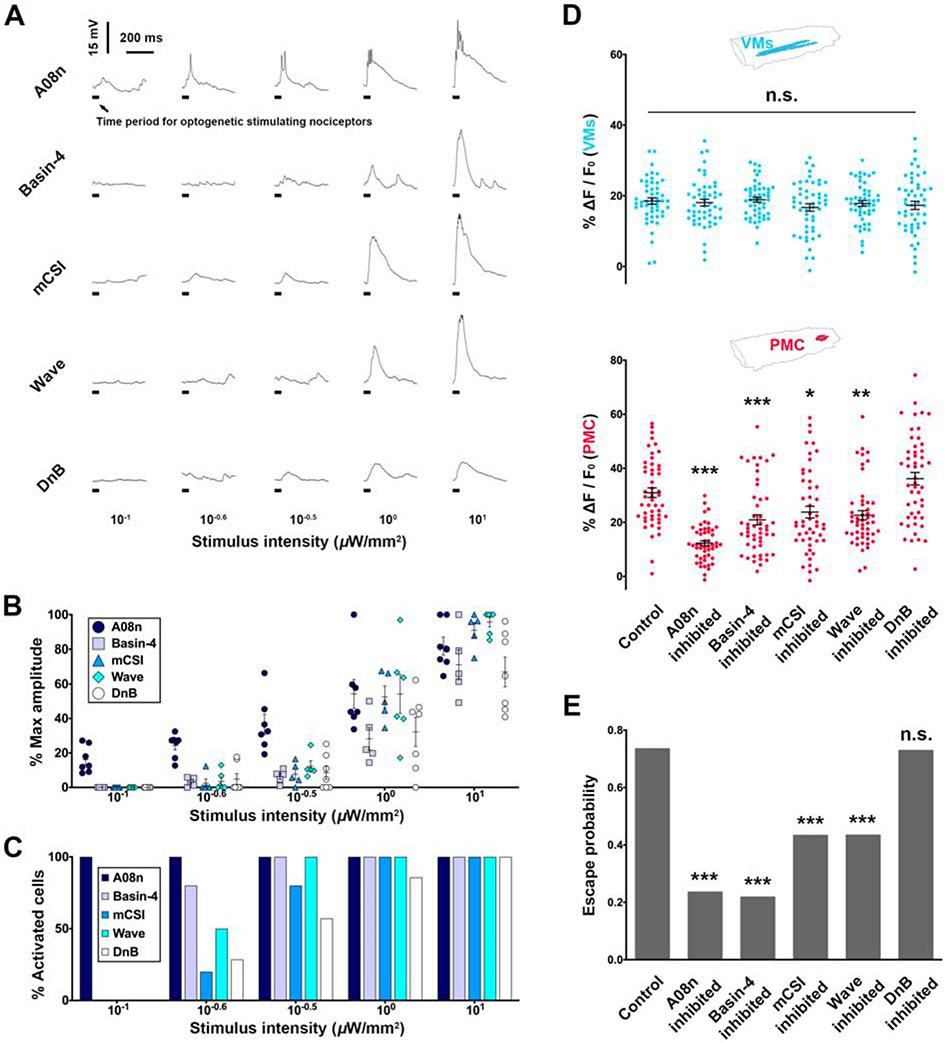
Figure 5. Escalated amplification of nociceptive encodings by stimulus-intensity-dependent recruitment of SONs.
(A-C) Whole-cell patch clamping demonstrates stimulus-intensity-dependent responses of different types of SONs. N = 7, 5, 5, 6, 7 cells for A08n, Basin-4, mCSI, Wave and DnB, respectively. (A) Representative traces of SON responses to various stimulus intensities. (B) The response amplitudes of different types of SONs. Each dot represents a cell. (C) Different types of SONs exhibit different minimal intensities of nociceptor stimulations for their activations. The minimum or maximum depolarization of each cell was identified by stimulating nociceptor from low to high intensity.
(D-E) Optogenetic inhibitions of different SONs impair PMC activities and escape probability to distinct extents. Neural activity levels (D): N = 50 larvae per genotype (each dot represents a larva). The control is from Figure 2A. Escape probabilities: N = 101, 103, 102, 101, 110 and 108 larvae for control, A08n, Basin-4, mCSI, Wave and DnB, respectively. One-way ANOVA (Dunnett’s post hoc) for neural activity level and Chi-square test (Bonferroni post hoc) for escape probability.

