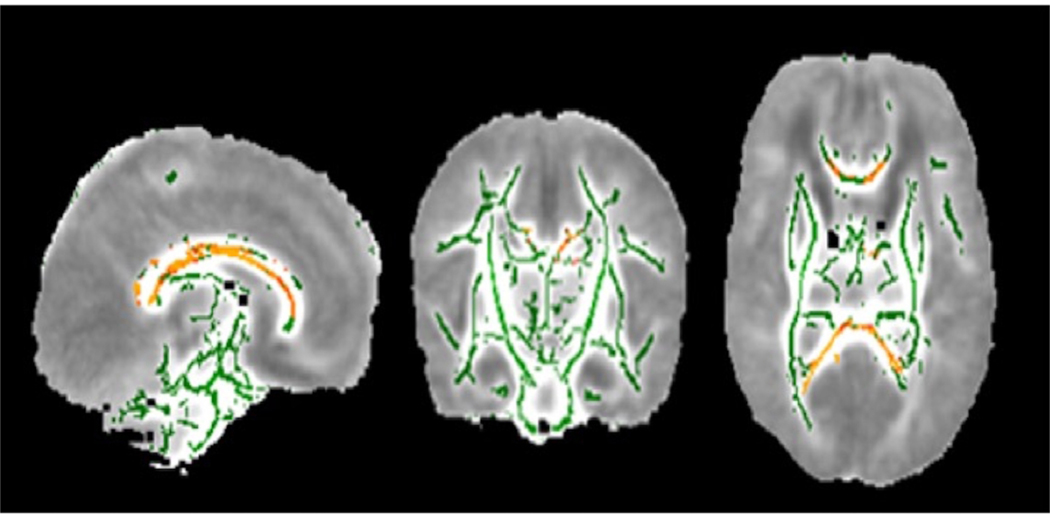
Figure 1: Tract-based spatial statistics (TBSS) results comparing infants that were and were not exposed to anesthesia during the neonatal period.
Yellow and Red tracts indicate decreased Fractional Anisotropy (FA) in anesthesia exposed infants in cingulate gyrus and corpus callosum. Green tracts indicate no difference in FA. (p <.05)

