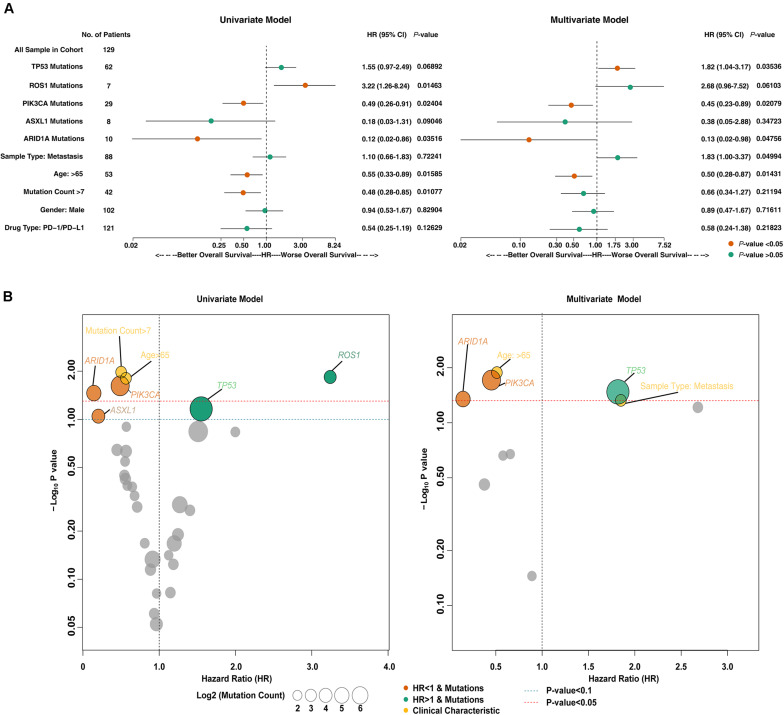
FIGURE 1.
The predictive value of clinical characteristics and mutant genes on ICIs efficacy. (A) Forest plots for the results of the univariate (left panel) and multivariate (right panel) Cox regression analyses. In the univariate Cox regression analysis, the factors with a p-value less than 0.1 were age, mutation count, and mutations in ROS1, PIK3CA, ARID1A, TP53, and ASXL1. The multivariate Cox regression analysis showed that age and ARID1A, PIK3CA, and TP53 mutations were independent predictors of ICI therapy in HNSC patients. The main portion of the forest plot presents the hazard ratio (HR) and 95% confidence interval (95% CI), where red dots indicate p < 0.05. The HR indicates the predictors of favorable (HR < 1) or poor (HR > 1) OS. (B) Bubble plots were used to visualize the results of the univariate (left panel) and multivariate (right panel) Cox regression analyses. The blue and red dashed lines indicate p-values of 0.1 and 0.05, respectively. The size of the circle indicates the mutation count. The gray circles represent variables with p < 0.1 (left panel) or p < 0.05 (right panel), and the yellow circles represent the clinical characteristics of patients. The color of other circles represents the gene mutations associated with a good (orange; HR < 1) or poor (green; HR < 1) prognosis.

