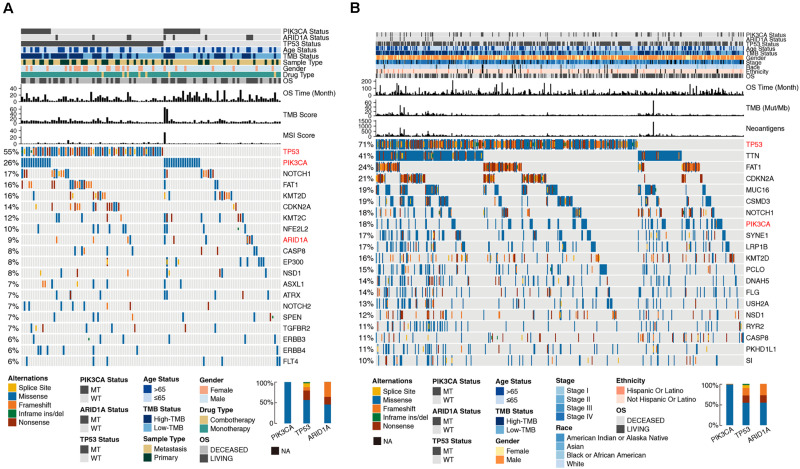
FIGURE 2.
Genomic profiles of HNSC patients in the MSKCC (A) and TCGA (B) cohorts. The top 20 genes with the highest mutation frequencies and the corresponding clinical information are shown in the figure. The top five genes with the highest mutation frequencies in the MSKCC cohort were TP53 (55%), PIK3CA (26%), NOTCH1 (17%), FAT1 (16%), and KMT2D (16%). The top six genes with the highest mutation frequencies in the TCGA cohort were TP53 (71%), TTN (41%), FAT1 (24%), CDKN2A (21%), MUC16 (19%), and CSMD3 (19%). Among the three genes selected from the multivariate Cox regression analysis, TP53 had the highest mutation rate in both clinical cohorts (55 and 71%, respectively), followed by PIK3CA (26 and 18%, respectively), and ARID1A (9 and 4%, respectively). The alteration types of TP53 were dominated by missense, nonsense and frameshift mutations. Missense mutations were the main mutation type of PIK3CA, and nonsense and frameshift mutations were the main mutation types of ARID1A. The mutation types are indicated as follows: yellow indicates splice sites, blue indicates missense mutations, orange indicates frameshift mutations, green indicates inframe insertion/deletion, and brown indicates nonsense mutations. The mutation status of ARID1A, PIK3CA, and TP53, TMB status, MSI score, neoantigen status, OS, and other clinical characteristics are shown as patient annotations (upper barplot). The left barplot marks the mutation rate of each gene. Genes marked in red represent the three genes screened from the multivariate Cox regression analysis. In the figure legends, “MT” represents patients with a certain gene mutation, and “WT” represents patients without certain gene mutation.

