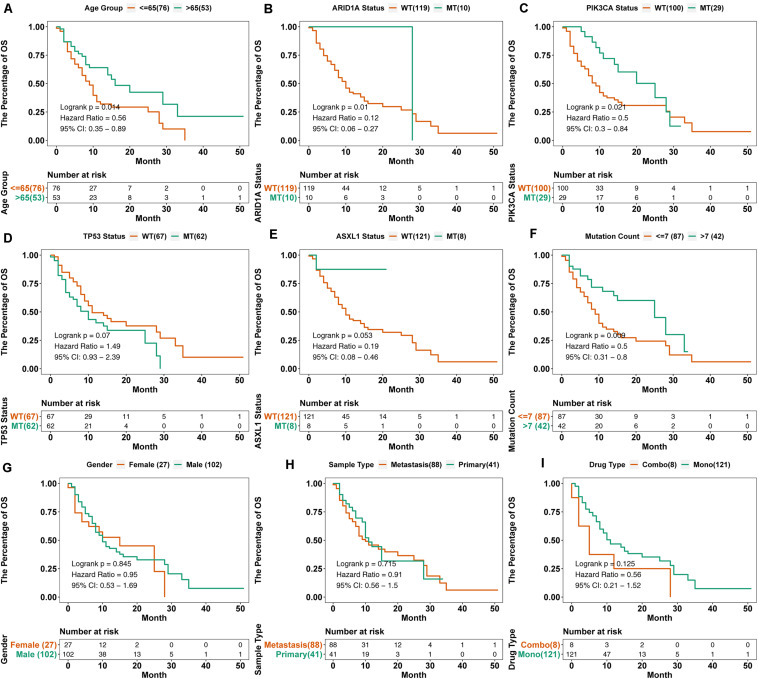
FIGURE 3.
KM survival curves for OS in 129 HNSC patients from the MSKCC cohort. We performed KM survival analysis on different subgroups of patients based on age (A), gene mutation status (B–E), mutation count (F), sex (G), sample type (H), and drug type (I). “Combo” represents the combination treatment of anti-PD-(L)1 and anti-CTLA-4 therapy, and “Mono” represents anti-PD-(L)-1 monotherapy.

