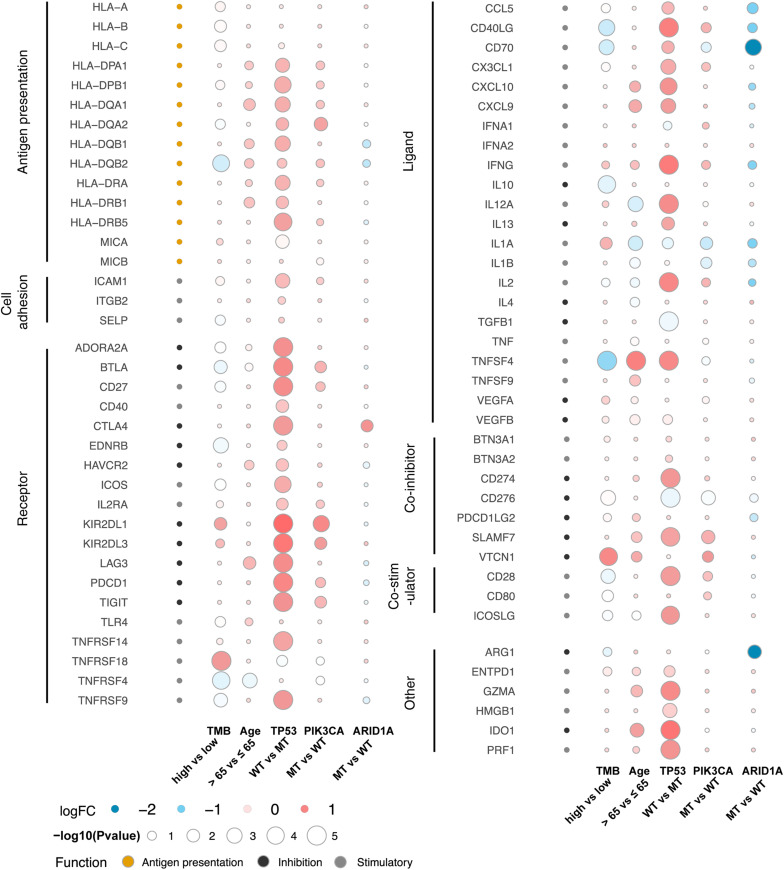
FIGURE 5.
Bubble plots showing the expression of immune-related genes and immune exhaustion biomarkers. The color of the circles in the first column represents the categories of the molecules according to their functions, in which orange represents antigen presentation, black represents inhibitory molecules, and gray represents stimulatory molecules. The color of the other circles indicates logFC, as shown in the legend, and the size is proportional to the statistical significance.

