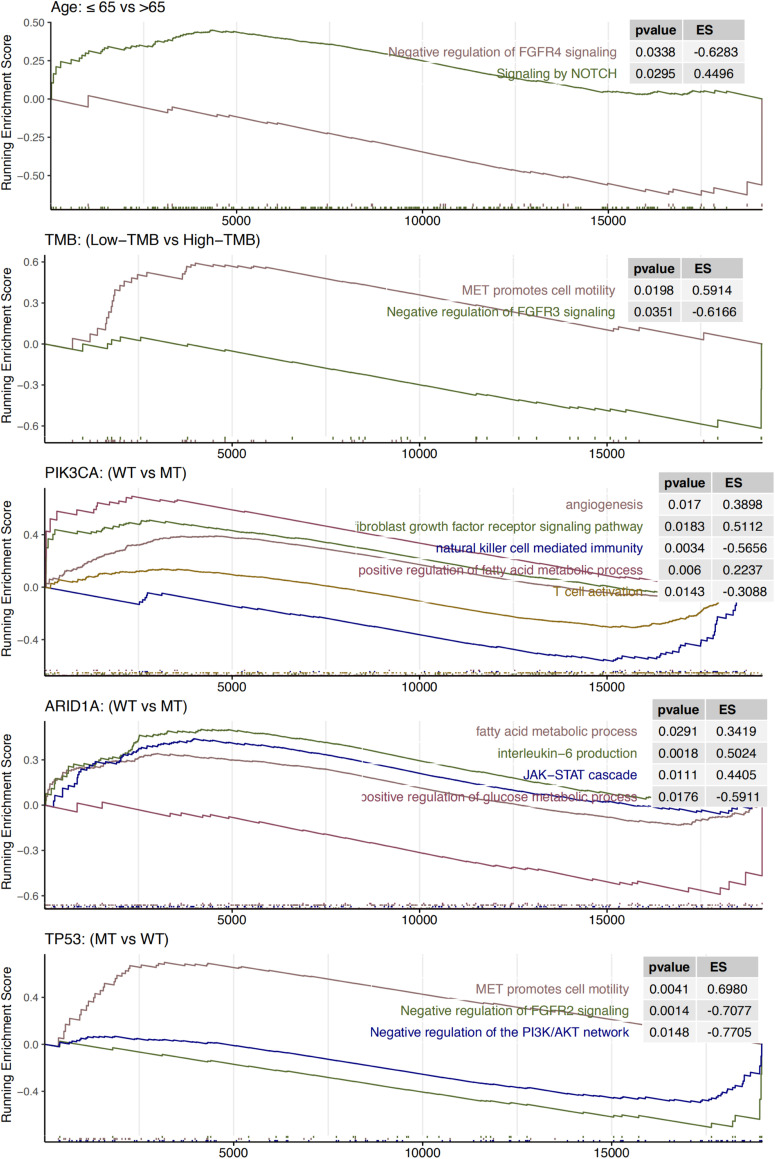
FIGURE 6.
Results of gene set enrichment analysis. The following subgroups served as control groups: age > 65 years, high TMB, ARID1A-MT, PIK3CA-MT, and TP53-WT. ES > 0 indicates that the corresponding pathways are significantly enriched in the experimental groups. Colors of curves correspond to the font colors of the pathway names.

