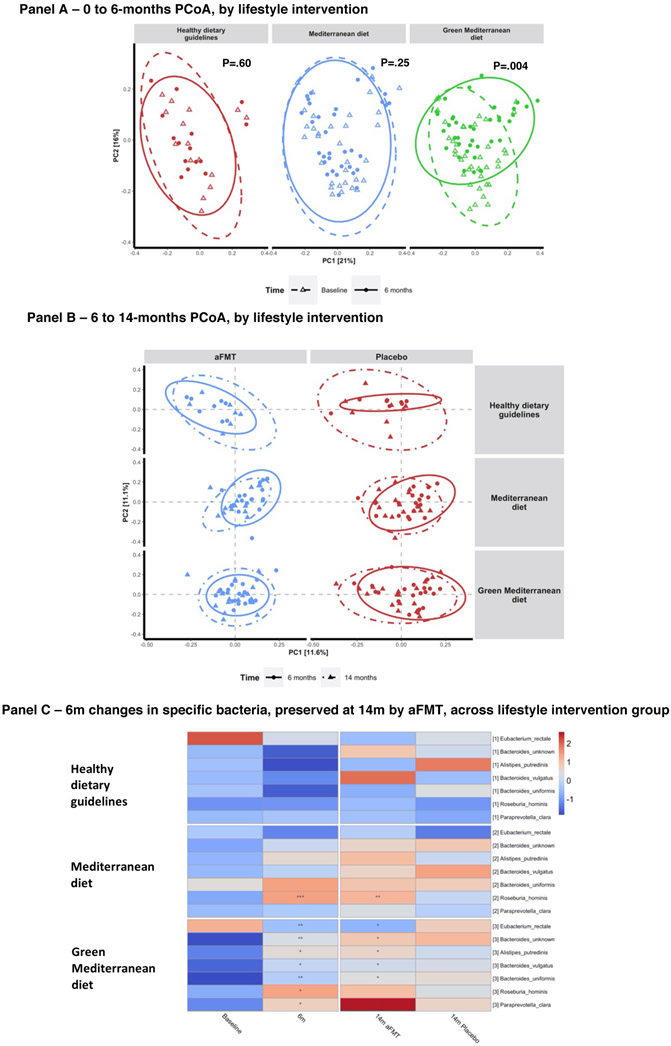
Figure 4: Microbiome composition and species-level changes.
Panel A: Principal coordinate analysis (PCoA) of weighted UniFrac distances of microbiome composition measured by 16s rRNA sequencing. Each sub-plot displays the distances between individual microbiome samples within the distances of the indicated lifestyle intervention, at baseline and 6-months. Panel B: Principal coordinate analysis (PCoA) of Bray-Curtis distances of microbiome composition, each sub-plot displays the distances between individual microbiome samples within the indicated lifestyle intervention and treatment group, at 6 and 14-months. 95% standard error ellipses are shown for each sub-group; Panel C: Shotgun metagenomics assessed species (B) that were significantly changed by weight loss and maintained by the aFMT treatment, across lifestyle intervention groups.

