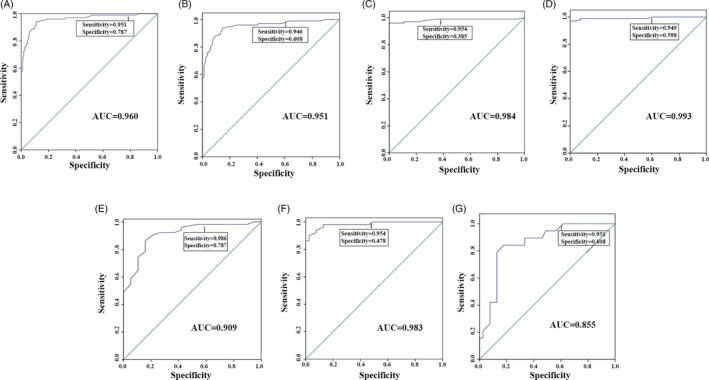
FIGURE 2.

ROC analysis of miR‐212 serum level and different stages of Gastric cancer patients (GC patients) and health persons (Control). A, All of GC patients vs Control. B, stages I‐II of GC patients vs Control. C, Stage III of GC patients vs Control. D, Stage IV of GC patients vs Control. ROC analysis of miR‐212 serum level of different stage of Gastric cancer patients (GC patients). E, Stage I‐II vs stage III. F, Stage I‐II vs stage IV. G, Stage III of GC patients vs stage IV
