Abstract
Objective
Previous research has shown that the miR‐130 family is closely related to the occurrence and development of bladder cancer. We hope to use the miR‐130 family members as new, non‐invasive, and easily detectable biomarkers for bladder cancer.
Methods
We analyzed 428 cases in The Cancer Genome Atlas‐Bladder Urothelial Carcinoma database and verified that the miR‐130 family members were significantly overexpressed in bladder cancer. A total of 74 bladder cancer patients and 90 controls were enrolled. The relative expression of the miR‐130 family in serum was detected using quantitative reverse transcription‐polymerase chain reaction. The diagnostic efficacy of the miR‐130 family members was determined using the receiver operating characteristic method (ROC), and a diagnostic panel was built using logistic regression. The results of the study were further confirmed in an external validation set of 492 samples from the Gene Expression Omnibus database.
Results
The expression of the miR‐130 family members (except for miR‐301b‐3p) in the serum of bladder cancer patients was higher than that in the controls. The diagnostic capabilities for bladder cancer were 0.847 (miR‐130a‐3p), 0.762 (miR‐130b‐3p), and 0.892 (miR‐301a‐3p). We established a three‐miRNA panel with an area under the ROC curve as high as 0.961, indicating that it is a promising clinical diagnostic biomarker of bladder cancer with high sensitivity and specificity.
Conclusion
The expression levels of miR‐130 family members in serum can effectively distinguish the bladder cancer patients from healthy controls. This finding will facilitate the clinical diagnosis of bladder cancer.
Keywords: bladder cancer, circulating biomarker, diagnosis, non‐invasive detection
The miR‐130 family members are highly expressed in the serum of bladder cancer patients. Their expression levels can effectively distinguish bladder cancer patients from healthy controls.
1. INTRODUCTION
Bladder cancer (BC) is one of the 10 most common tumors and the most common malignant tumor of the urinary system, accounting for approximately 4.7% of adult malignancies. 1 , 2 Approximately 356 000 new cases are recorded and 145 000 people die of BC worldwide each year. 3 Unlike many other malignancies, there has been little improvement in the diagnosis, treatment, and five‐year survival rate of BC over the past three decades. 4 At present, the main contradictions in the diagnosis and treatment of BC focus on early screening and monitoring of recurrence. The existing methods of diagnosing BC cannot meet the actual clinical needs. Cystoscopy remains the gold standard for detecting BC. Owing to its invasiveness, as many as 5.5% of patients may develop a urinary tract infection after cystoscopy. 5 Most patients feel discomfort and pain during the examination, and symptoms such as mild hematuria, frequent urination, and dysuria appear after the examination. Long‐term frequent cystoscopy after surgery can cause considerable mental stress to patients who are already weak. 6 Therefore, finding new feasible diagnostic methods will benefit many patients with BC.
The development of BC diagnostic biomarkers has aroused substantial interest but has not yet been validated and used clinically in subsequent studies. 7 , 8 Biomarkers with high specificity and sensitivity from body fluids may be useful tools for non‐invasive cancer detection.
MicroRNA (miRNA) is a group of endogenous single‐stranded non‐coding RNAs. They negatively regulate gene expression by binding to the 3′ untranslated region of the related messenger RNAs, leading to mRNA degradation or translation inhibition. 9 , 10 Increasing evidence has shown that miRNAs can be stably detected in circulating blood, and circulating miRNAs have become a reliable biomarker for early screening of diseases, including tumors. 11 , 12 , 13 Members of the miR‐130 family (miR‐130a‐3p, miR‐130b‐3p, miR‐301a‐3p, and miR‐301b‐3p) share common seed sequences, and they perform similar biological functions. They have been reported to promote cell proliferation and upregulation in several types of cancer. 14 , 15 , 16 , 17 , 18 , 19 , 20 A recent study showed that the miR‐130 family may play a vital role in the occurrence and development of BC by regulating signal pathways through various target genes, including PTEN and PTPN11. 21 Nevertheless, whether they can be used as circulating biomarkers for BC diagnosis has not been confirmed.
In this study, we evaluated the expression of miR‐130 family members in BC tissues and patient serum. Through statistical analysis and external data set verification, we found that the expression of serum miR‐130 family members can effectively distinguish patients from controls. We also constructed a three‐miRNA panel, which considerably improved diagnostic capabilities.
2. MATERIALS AND METHODS
2.1. Study design
First, we analyzed the differential expression of the miR‐130 family (miR‐130a‐3p, miR‐130b‐3p, miR‐301a‐3p, and miR‐301b‐3p) in BC and adjacent tissues through The Cancer Genome Atlas (TCGA) database. We then collected serum from 74 patients with BC and 90 healthy controls (HCs). The quantitative reverse transcription‐polymerase chain reaction (qRT‐PCR) and spiked‐in normalization method were used to identify the expression of the miR‐130 family in serum. We evaluated the diagnosis values of the miR‐130 family as biomarkers for early detection of BC through several statistical analyses. A diagnostic panel was built by the logistic regression model. Finally, we used a Gene Expression Omnibus dataset (including 492 samples) as an external validation set to verify the diagnostic capabilities of the serum miR‐130 family for BC. In hopes of understanding their biological mechanism in tumorigenesis and development, we performed bioinformatics analyses, including target gene prediction and enrichment analysis. The flowchart of this study is shown in Figure 1.
Figure 1.
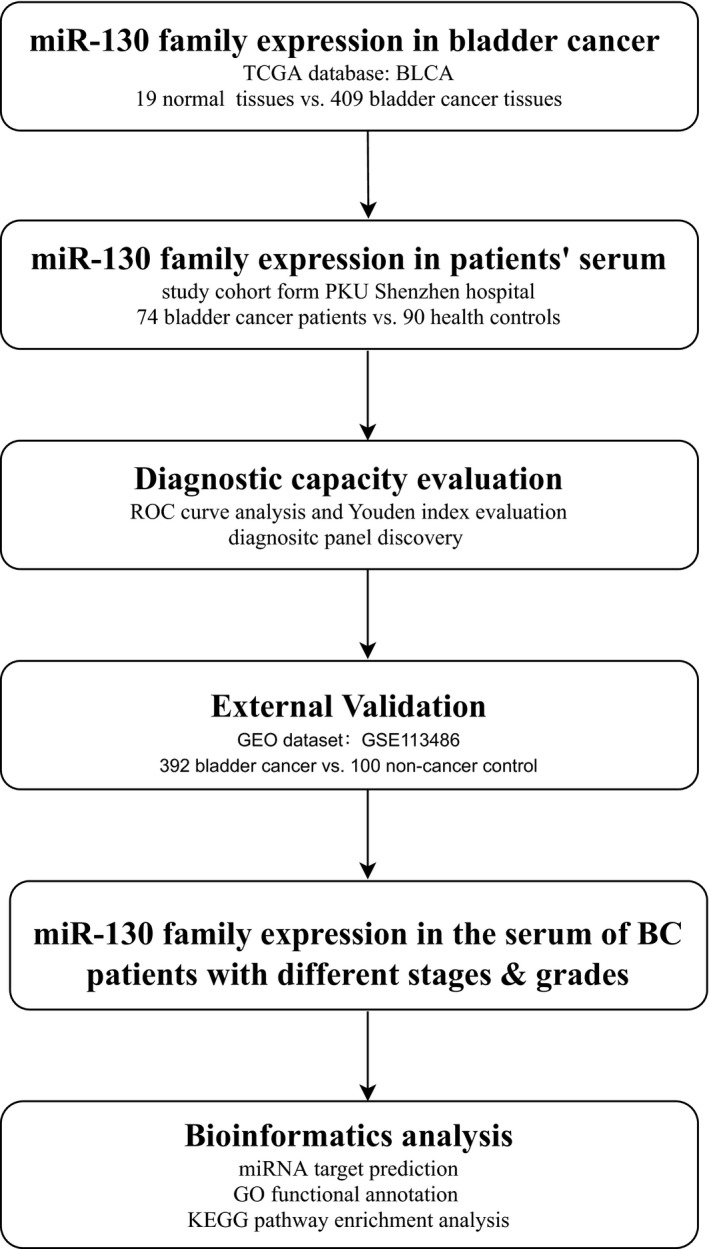
The flowchart of the study design. BLCA: bladder urothelial carcinoma; ROC: receiver operating characteristic
2.2. Participants and ethics statement
A total of 164 participants, including 74 BC patients and 90 HCs, were recruited for serum samples from Peking University Shenzhen Hospital between June 2017 and July 2019. Histological classification was based on World Health Organization standards. Staging was confirmed according to the TNM staging system. To select HCs, we used asymptomatic healthy volunteers with no history of cancer or other benign diseases. These HCs were matched to BC patients based on age and gender. Table 1 lists the demographic and clinical characteristics of the participants. There were no significant differences in age or gender distributions between BC patients and HCs (P‐value > .05). Participants gave their informed consent before sample collection. The study was conducted following the Declaration of Helsinki, and the Ethics Committee of Peking University Shenzhen Hospital approved the protocol of the study. The serum sample collection process complied with the relevant regulations formulated by the committee.
Table 1.
Demographic and clinical characteristics of 164 participants enrolled in the study
| BC patients | HCs | |
|---|---|---|
| Total number | 74 | 90 |
| Age (Mean ± SD) | 63.8 ± 13.5 | 56.6 ± 13.1 |
| Gender (%) | ||
| Male | 54 (73.0) | 42 (46.7) |
| Female | 20 (27.0) | 48 (53.3) |
| Tumor stage (%) | ||
| TaN0M0 | 26 (35.1) | |
| T1N0M0 | 30 (40.5) | |
| T2N0M0 | 13 (17.6) | |
| ≥pT3 | 5 (6.8) | |
| Pathological grade (%) | ||
| Low grade | 35 (47.3) | |
| High grade | 39 (52.7) | |
Abbreviations: BC: bladder cancer; HCs: healthy controls.
2.3. miRNA‐sequencing data and microarray data acquisition
The miRNA‐sequencing data for Bladder Urothelial Carcinoma (BLCA) were downloaded from TCGA database. The BLCA miRNA data included 19 normal bladder epithelial tissues, 409 bladder urothelial carcinoma tissues, with eight repeated cancerous ones excluded. The clinical information of the patients was also acquired from TCGA data portal. Serum miRNA expression profiles, GSE113486, were downloaded from the Gene Expression Omnibus database. GSE113486 contains 972 serum samples, which consist of 392 BC, 100 non‐cancer controls, and 480 other types of cancer patients. The expression data and clinical information of BC patients and normal controls were used in this study. The platform of the dataset was GPL21263 Toray Industries. The probes were converted into the corresponding miRNA symbols according to the annotation information on the platform. All miRNA expression data were standardized and subjected to log2 transformation before further analysis.
2.4. Sample collection and RNA extraction
For the serum preparation, 10 mL peripheral blood of each participant was collected before any treatment. Within 2 hours, the peripheral blood was centrifuged at 1000 g for 10 minute and 15 000 g for 5 minutes at 4°C. We used 4 mL of supernatant (serum) in each sample for subsequent experiments. To control variability in the extraction and purification process, 2 µL of 10 nmol/L synthetic Caenorhabditis Elegans miRNA‐39 (RiboBio, Guangzhou, China) was spiked into each serum sample ahead of the procedure. Total RNA was extracted from serum using a TRIzol LS isolation kit (Thermo Fisher Scientific) according to the manufacturer's instructions. Total RNA was resuspended with 30 µL RNase‐free water and stored at −80°C for further analysis. The concentration and purity of RNA were analyzed using a NanoDrop 2000 spectrophotometer (NanoDrop).
2.5. qRT‐PCR
The amplification of miRNAs was conducted using specific primers of reverse transcription from the Bulge‐Loop miRNA qRT‐PCR Primer Set (RiboBio, Guangzhou, China). The real‐time polymerase chain reaction was performed by using an SYBR Green qPCR kit (SYBR Pre‐mix Ex Taq II, TaKaRa) on a LightCycler 480 Real‐Time PCR System (Roche Diagnostics, Mannheim, Germany) in 384‐well plates at 95°C for 30 seconds, followed by 35 cycles of 95°C for 10 seconds, 60°C for 20 seconds, and then 70°C for 10 seconds. The specificity of the PCR product was tested by melting curve analysis. All reactions were performed in triplicate or more. The relative expression levels of target miRNAs were determined by using the 2−ΔΔ C t method 22 and normalized to the spiked‐in control cel‐miR‐39.
2.6. Bioinformatic analysis
To identify the functional involvement of the miR‐130 family in BC, we predicted a list of miRNA targets in miRWalk2.0 (http://zmf.umm.uni‐heidelberg.de/mirwalk2), a comprehensive archive of predicted and experimentally verified miRNA‐target interactions. 23 In general, 12 servers with miRWalk, miRMap, MicroT4, miRNAMap, TargetScan, PICTAR2, miRBridge, PITA, miRanda, RNAhybrid, miRDB, and RNA22 were performed. Only the genes predicted by more than eight of the servers were recognized as target genes. Functional annotation and enrichment analysis for predicted target genes were conducted by Enrichr database (http://amp.pharm.mssm.edu/Enrichr/). 24 Gene Ontology annotation (GO) and Kyoto Encyclopedia of Genes And Genomes (KEGG) pathway analysis were included in this study.
2.7. Statistical analysis
Demographic and clinical characteristics among different groups were presented as count numbers with percentage or mean value ± standard deviation. Multiple comparisons among separate independent phases were conducted using the Kruskal‐Wallis rank test. The different expression levels of each miRNA between serum samples of BC and HCs and between serum samples of high‐grade and low‐grade BC patients were analyzed by a Student's t test or the Mann‐Whitney test. The different expression levels of each miRNA in the serum of patients with different stages were assessed by applying an analysis of variance (ordinary or Welch's) followed by a multiple comparison test (Tukey's or Games‐Howell's multiple comparison test) to compare the mean of each stage with the mean of every other stage. Multiple logistic regression analysis was performed to set up the miRNA signature. The calibration was evaluated by the Hosmer‐Lemeshow goodness‐of‐fit test. Receiver operating characteristic (ROC) curves and the area under the ROC curve (AUC) were used to estimate the diagnostic value of miRNAs. The optimal sensitivity and specificity were determined by the Youden index (calculated as J = Sensitivity +Specificity − 1). The diagnostic panels were built by the stepwise logistic regression model. All statistical analyses were performed using SPSS software (Version 20, Chicago, IL, USA), GraphPad Prism (Version 8, La Jolla, CA, USA), and Medcalc (Version 19, Ostend, Belgium). A P‐value of less than .05 was defined as statistically significant.
3. RESULTS
3.1. Expression of miR‐130 family members in BC tissues
We downloaded BLCA miRNA‐isoform sequencing data from TCGA database. A total of 19 normal bladder epithelium and 409 BC epithelial miRNA‐sequencing data were included. As shown in Figure 2, three members (miR‐130a‐3p, miR‐130b‐3p, and miR‐301a‐3p) of the miR‐130 family were highly upregulated in BC tissue, and the results were statistically significant. We found no difference in the expression of miR‐130 in BC and normal tissues. The result shows that the miR‐130 family may play a carcinogenic role in BC and may serve as diagnostic biomarkers for BC.
Figure 2.
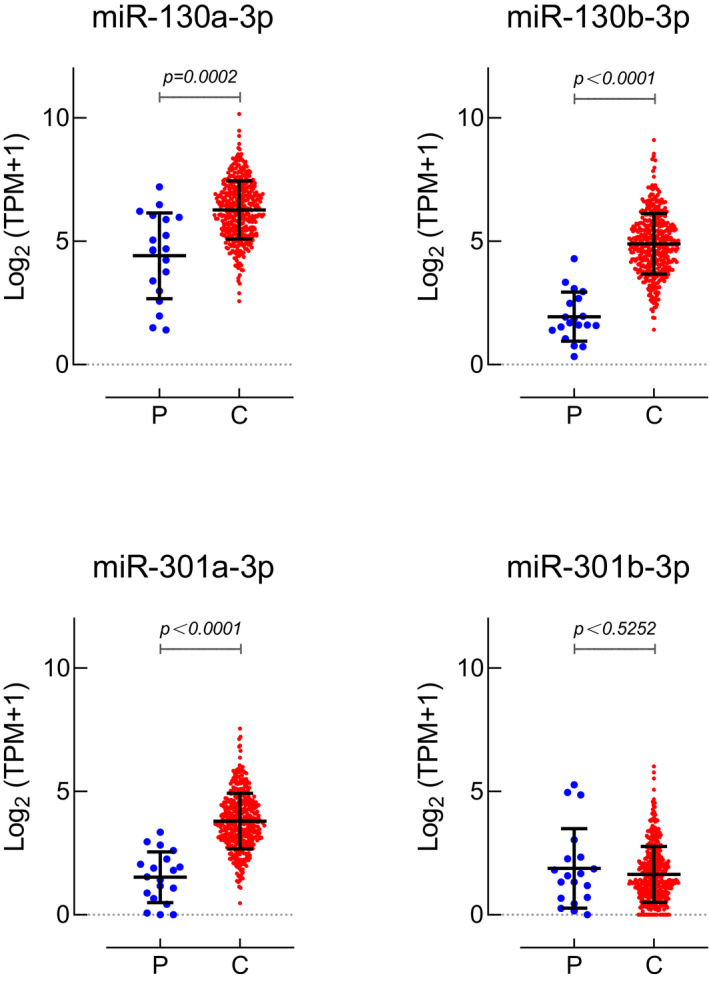
Expression profiles of miR‐130 family members in bladder cancer tissues. Data were downloaded from The Cancer Genome Atlas database, including 19 para‐carcinoma tissues (P), 409 bladder urothelial carcinoma tissues (C). TPM: Transcripts Per Kilobase of exonmodel per Million mapped reads
3.2. Expression and diagnostic efficacy of miR‐130 family members in the serum of BC patients
Using the qRT‐PCR method, we detected relative expression levels of the miR‐130 family of the preoperative serum of 74 BC patients and the serum of 90 HCs. The expression of miR‐130a‐3p (Figure 3A), miR‐130b‐3p (Figure 3C), and miR‐301a‐3p (Figure 3E) in the serum of patients with BC was significantly higher than that in normal human serum. The expression level of miR‐301b‐3p (Figure 3G) was not different between the two groups of samples. Through ROC analysis, we could see the sensitivity and specificity of miR‐130 family members to distinguish the two groups of samples at different cutoff values. The AUCs were 0.847 (Figure 3B), 0.762 (Figure 3D), 0.892 (Figure 3F), and 0.707 (Figure 3H) for miR‐130a‐3p, miR‐130b‐3p, miR‐301a‐3p, and miR‐301b‐3p, respectively.
Figure 3.
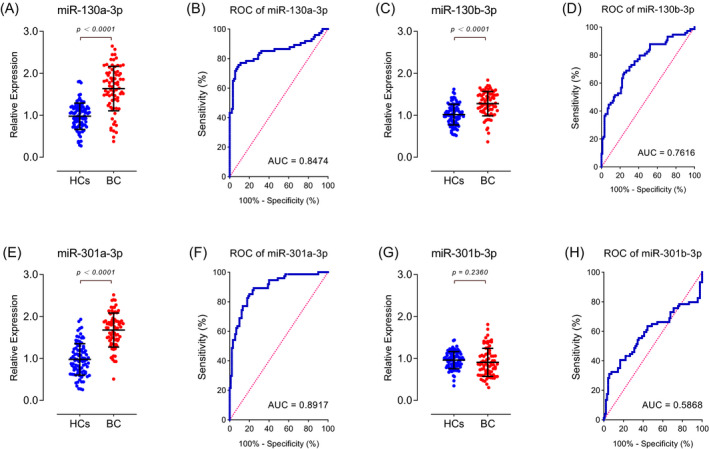
Expression and diagnostic efficacy of miR‐130 family members in the serum of bladder cancer patients. The expression of (A) miR‐130a‐3p, (C) miR‐130b‐3p, and (E) miR‐301a‐3p in the serum of patients is significantly higher than that in control serum. The expression level of (G) miR‐301b‐3p was not different between the two groups. The AUCs were (B) 0.847, (D) 0.762, (F) 0.892, and (H) 0.707 for miR‐130a‐3p, miR‐130b‐3p, miR‐301a‐3p, and miR‐301b‐3p, respectively. HCs group includes serum of 90 healthy controls and BC group includes serum of 74 patients. ROC: receiver operating characteristic; AUC: area under the ROC curve
3.3. The combination of miR‐130 family members becomes credible BC diagnostic biomarker
One single miRNA could be used to distinguish BC patients from HCs, a combination of several miRNAs might provide higher accuracy than individual miRNAs. Therefore, we combined the expression data of three miR‐130 family members (miR‐130a‐3p, miR‐130b‐3p, and miR‐301a‐3p), building a diagnostic panel by the stepwise logistic regression model. We found that the AUC for the three‐miRNA panel was 0.961 (95% confidence interval: 0.935 to 0.986; sensitivity = 87.8%, specificity = 93.3%; Figure 4). The model had a Hosmer‐Lemeshow P‐value of 0.2 suggesting an adequate calibration. The model was calculated with the following formula:
Figure 4.
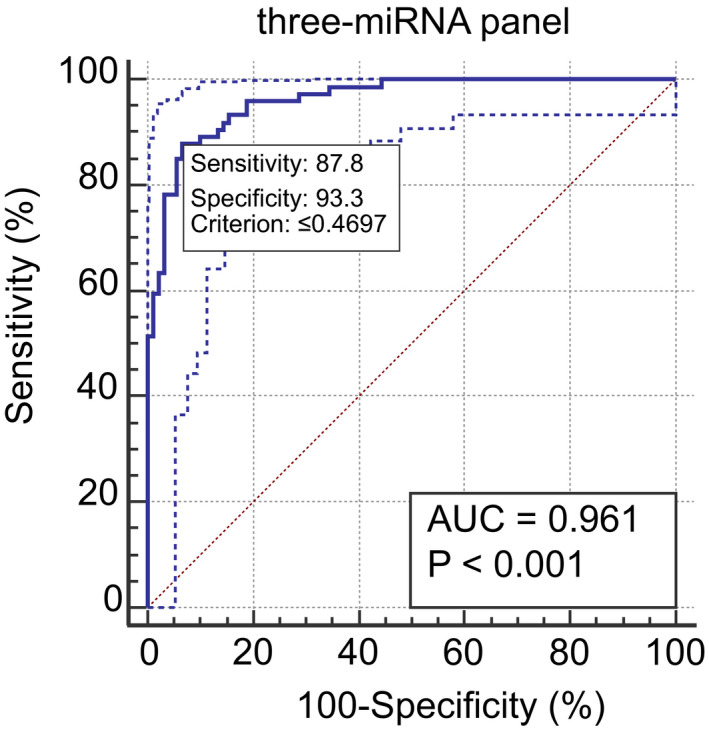
ROC results for the three‐miRNA panel (miR‐130a‐3p, miR‐130b‐3p, and miR‐301a‐3p). The AUC of the panel is 0.961 (95% CI: 0.935 to 0.986; sensitivity = 87.8%, specificity = 93.3%)
3.4. External validation of miR‐130 family expression in serum of BC patients
We used GSE113486 as the external validation set for this experiment, which has 392 BC serum samples and 100 control serum samples. Figure 5 shows the signal intensity of each miR‐130 family member in the two groups of samples. Because of the sensitivity of gene microarray detection and the low titer of miRNA expression in serum, many undetected cases of miR‐130 family members occurred both in the tumor group and the control group. However, this situation did not greatly affect the results. The signal intensity of miR‐130a‐3p (2.725 fold change, Figure 5A), miR‐130b‐3p (2.134 fold change, Figure 5B), and miR‐301a‐3p (2.363 fold change, Figure 5C) in the serum of BC patients was significantly higher than that in the control group. No difference in signal intensity of miR‐130b‐3p (Figure 5D) was found in the two groups.
Figure 5.
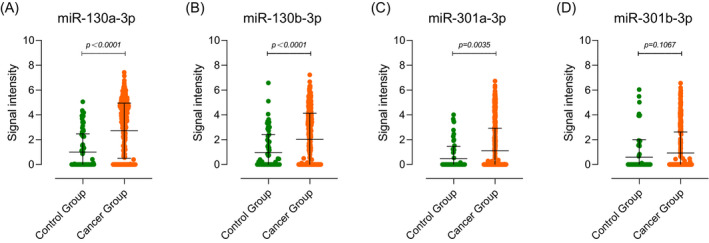
External validation of miR‐130 family expression in serum of bladder cancer patients. The signal intensity of (A) miR‐130a‐3p (2.725 fold change), (B) miR‐130b‐3p (2.134 fold change), and (C) miR‐301a‐3p (2.363 fold change) was significantly higher in the cancer group. No difference in signal intensity of (D) miR‐130b‐3p in the two groups
3.5. The expression of miR‐130 family members in the serum of BC patients with different stages and grades
In order to understand the relationship between the serum expression level of miR‐130 family members and the BC tumor stage/grade, we conducted further data analysis. In our study cohort, there were 26 TaN0M0 patients, 30 T1N0M0 patients, 13 T2N0M0 patients, and 5 pT3 ≥ 5 patients. A total of 35 patients with low‐grade BC and 39 patients with high‐grade BC were included. As shown in Figure 6A and 6C, the expression levels of miR‐130a‐3p and miR‐301a‐3p were significantly correlated with tumor stage. Their expression in the serum of patients with early‐stage tumors was significantly lower than that of patients with advanced‐stage tumors. The serum expression levels of miR‐130b‐3p (Figure 6B) and miR‐301b‐5p (Figure 6D) had no relationship with tumor stage. Next, we analyzed the serum expression of the miR‐130 family in BC patients with different pathological grades. As shown in Figure 6E‐6H, the miR‐130 family was more expressed in the serum of high‐grade BC patients than in low‐grade patients. Notably, the expression level of miR‐301a‐3p (Figure 6G) was significantly different between the two groups of patients.
Figure 6.
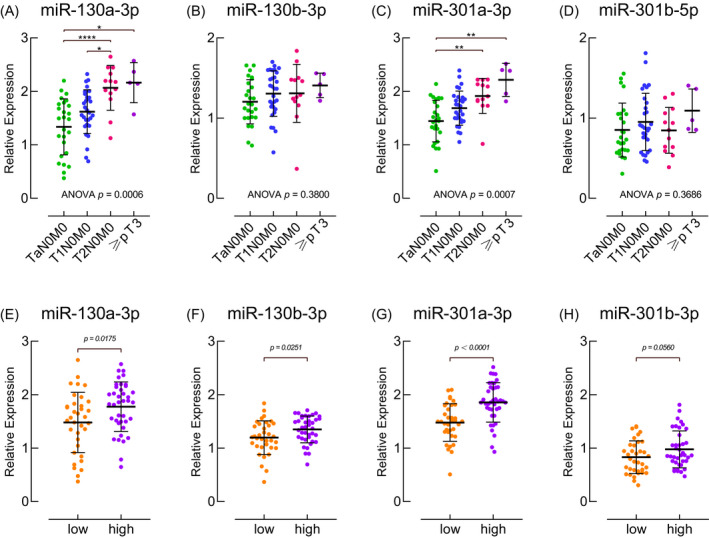
The expression of miR‐130 family members in the serum of BC patients with different stages (26 TaN0M0 patients, 30 T1N0M0 patients, 13 T2N0M0 patients, and 5 pT3 ≥ 5 patients) and grades (35 low‐grade patients and 39 high‐grade patients). * P < .05, ** P < .01, *** P < .001, **** P < .0001
3.6. Bioinformatics analysis of candidate miRNAs
From miRWalk2.0, a total of 632 genes targeted by miR‐130 family members were predicted by nine algorithms or more. Next, we mapped them into the Enrichr database for GO functional annotation and KEGG pathway enrichment analysis. The biological process, cellular component, and molecular function were included in the GO functional annotation. A variety of GO terms were discovered, and the top 10 enriched GO terms in each GO item are shown in Figure 7A‐C, including negative regulation of transcription, DNA‐templated (GO:0 045 892), negative regulation of gene expression (GO:0 010 629), negative regulation of cellular macromolecule biosynthetic process (GO:2 000 113) in the biological process category; early endosome (GO:0 005 769), chromatin (GO:0 000 785), centrosome (GO:0 005 813) in the cellular component category; and transcription regulatory region DNA binding (GO:0 044 212), phosphatase binding (GO:0 019 902), core promoter proximal region sequence‐specific DNA binding (GO:0 000 987) in the molecular function category. The KEGG pathway analysis for the target genes demonstrated that they were significantly enriched in BC, pathways in cancer, endocytosis, TGF‐beta signaling pathway, and FoxO signaling pathway (Figure 7D).
Figure 7.
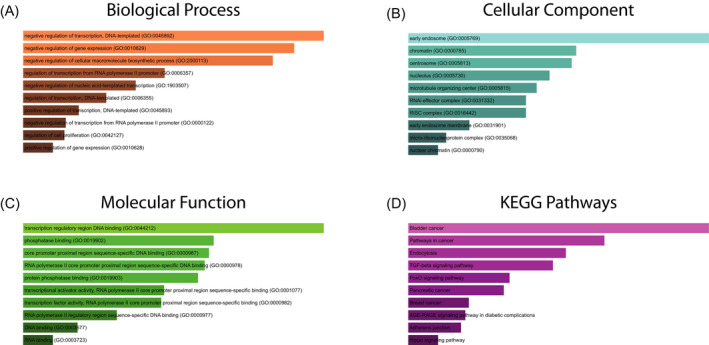
GO functional annotation and KEGG pathway enrichment analysis of the target genes of miR‐130 family. A, Biological process (BP) analysis; B, cellular component (CC) analysis; C, molecular function (MF) analysis; D, KEGG pathway enrichment analysis
4. DISCUSSION
Early diagnosis and screening of BC are closely related to patient prognosis and quality of life. Finding new feasible diagnostic methods will benefit many patients with BC. Circulating miRNA screening is a novel and widely available diagnostic tool, especially due to its non‐invasive nature. However, only a few studies examined circulating miRNA from BC patients as diagnostic biomarkers. 25 , 26 , 27 , 28 , 29 , 30 These studies usually recommend miRNA panels consisting of four to ten different miRNAs for BC diagnosis. The disadvantage of these studies is that the source of the miRNA detected is difficult to clarify. It is possible that the miRNA biomarkers are BC‐specific, or common in patients with the disease, or even secreted by the human coagulation system. For example, a study claimed that miR‐92a‐3p was differentially expressed in the blood of BC patients, 30 but the main limitation is that miR‐92a‐3p can also be detected in red blood cells. 31 Therefore, a highly specific BC diagnostic biomarker must be secreted by BC cells and have certain physiological functions. Another constraint is that in most studies, the number of samples examined is limited, and only single‐center studies have been conducted. In the process of searching for new markers, it is critical to confirm the clinical availability of the markers in multicenter studies. 32
In this study, we focused on the miR‐130 family. The human miR‐130 family has four members who share a common seed sequence. 33 Different studies have shown that miR‐130a‐3p is involved in different tumor pathogenesis, including esophageal adenocarcinoma, 19 hepatocellular carcinoma, 34 gastric cancer, 35 and ovarian carcinoma. 36 miR‐130b‐3p also plays a role in tumorigenesis and development, such as endometrial cancer 37 and non‐small cell lung cancer. 18 Research on miR‐301a‐3p and miR‐301b‐3p has focused on pancreatic, 38 colorectal, 39 hepatocellular, 16 and lung cancer. 17 These miRNAs are upregulated and play a pro‐cancer role in many cancers, and high expression in tumor tissues is often associated with poor prognosis.
A previous study has shown that the miR‐130 family promotes cell migration and invasion in BC by regulating PTEN phosphorylation through FAK and Akt phosphorylation. 21 However, there are no studies on the clinical application of miR‐130 family members in the diagnosis and treatment of BC. We put forward that it is possible to use the miR‐130 family in serum as biomarkers to distinguish BC patients from healthy people. The results of our study are satisfactory. We analyzed TCGA‐BLCA data and found that in addition to miR‐301b‐3p, other members of the miR‐130 family were significantly overexpressed in BC tissue, which confirmed the results of previous studies. We then tested sera from 164 BC patients and controls. It was found that the above three members were also significantly enriched in the serum of BC patients, and the fold changes were all more than two times. ROC analysis showed that their AUCs as biomarkers were all above 0.75. Combining them with logistic regression, we built a three‐miRNA panel. The AUC of the panel was as high as 0.961, indicating that it had an excellent clinical diagnosis ability for BC. The subsequent external data validation (492 cases) also confirmed the reliability of our study. We also divided patients into several groups according to different clinical stages and pathological grades. It was found that the miR‐130 family was expressed more in the serum of high‐grade BC patients, and the expression levels of miR‐130a‐3p and miR‐301a‐3p were significantly correlated with tumor stage. GO enrichment analysis and KEGG pathway analysis of miR‐130 family downstream target genes also showed that miR‐130 family was involved in the occurrence and development of BC.
Although our findings are meaningful, they have certain limitations. The serum used in this study was taken from patients before surgery. We have found the clinical value of miR‐130 family members in the diagnosis of BC, but their ability to predict the prognosis of BC remains to be studied. Patients in this study will be followed‐up regularly to obtain prognostic data. Moreover, the number of patients in this study is relatively small, and multicenter verification is needed.
In conclusion, we found that miR‐130 family expression was significantly upregulated in the BC tissue and serum of BC patients compared to that in the healthy controls. We evaluated their ability to diagnose BC, with miR‐130a‐3p, miR‐130b‐3p, and miR‐301a‐3p being the most prominent. We found that the combined use of these miRNAs can increase the diagnostic value. The serum three‐miRNA panel can be considered as a new non‐invasive biomarker for early screening and diagnosis of BC.
CONFLICT OF INTEREST
The authors declare that there are no conflicts of interest.
ACKNOWLEDGMENTS
Science and Technology Development Fund Project of Shenzhen (no. JCYJ20180507183102747) and Clinical Research Project of Shenzhen Health Commission (no. SZLY2018023)
Wang J, Zhao L, Peng X, et al. Evaluation of miR‐130 family members as circulating biomarkers for the diagnosis of bladder cancer. J Clin Lab Anal. 2020;34:e23517 10.1002/jcla.23517
Jingyao Wang and Liwen Zhao contributed equally to this work.
Contributor Information
Yanni Han, Email: yqlord@163.com, Email: 2522649101@qq.com.
Yongqing Lai, Email: yqlord@163.com, Email: 2522649101@qq.com.
REFERENCES
- 1. Siegel RL, Miller KD, Jemal A. Cancer statistics, 2018. CA Cancer J Clin. 2018;68(1):7‐30. [DOI] [PubMed] [Google Scholar]
- 2. Li Y, Shan Z, Liu C, et al. MicroRNA‐294 Promotes Cellular Proliferation and Motility through the PI3K/AKT and JAK/STAT Pathways by Upregulation of NRAS in Bladder Cancer. Biochemistry (Mosc). 2017;82(4):474‐482. [DOI] [PubMed] [Google Scholar]
- 3. Li P, Yang X, Cheng Y, et al. MicroRNA‐218 Increases the Sensitivity of Bladder Cancer to Cisplatin by Targeting Glut1. Cell Physiol Biochem. 2017;41(3):921‐932. [DOI] [PubMed] [Google Scholar]
- 4. Berdik C. Unlocking bladder cancer. Nature. 2017;551(7679):S34‐s35. [DOI] [PubMed] [Google Scholar]
- 5. Burke DM, Shackley DC, O'Reilly PH. The community‐based morbidity of flexible cystoscopy. BJU Int. 2002;89(4):347‐349. [DOI] [PubMed] [Google Scholar]
- 6. Raharja PAR, Hamid A, Mochtar CA, Umbas R. Recent advances in optical imaging technologies for the detection of bladder cancer. Photodiagn Photodyn Ther. 2018;24:192‐197. [DOI] [PubMed] [Google Scholar]
- 7. Uttley L, Whiteman BL, Woods HB, Harnan S, Philips ST, Cree IA. Building the evidence base of blood‐based biomarkers for early detection of cancer: a rapid systematic mapping review. EBioMedicine. 2016;10:164‐173. [DOI] [PMC free article] [PubMed] [Google Scholar]
- 8. Feber A, Dhami P, Dong L, et al. UroMark‐a urinary biomarker assay for the detection of bladder cancer. Clinical epigenetics. 2017;9:8. [DOI] [PMC free article] [PubMed] [Google Scholar]
- 9. Bartel DP. MicroRNAs: genomics, biogenesis, mechanism, and function. Cell. 2004;116(2):281‐297. [DOI] [PubMed] [Google Scholar]
- 10. Calin GA, Croce CM. MicroRNA signatures in human cancers. Nat Rev Cancer. 2006;6(11):857‐866. [DOI] [PubMed] [Google Scholar]
- 11. Todeschini P, Salviato E, Paracchini L, et al. Circulating miRNA landscape identifies miR‐1246 as promising diagnostic biomarker in high‐grade serous ovarian carcinoma: A validation across two independent cohorts. Cancer Lett. 2017;388:320‐327. [DOI] [PubMed] [Google Scholar]
- 12. Lin XJ, Chong Y, Guo ZW, et al. A serum microRNA classifier for early detection of hepatocellular carcinoma: a multicentre, retrospective, longitudinal biomarker identification study with a nested case‐control study. Lancet Oncol. 2015;16(7):804‐815. [DOI] [PubMed] [Google Scholar]
- 13. Zhou J, Yu L, Gao X, et al. Plasma microRNA panel to diagnose hepatitis B virus‐related hepatocellular carcinoma. J Clini Oncol. 2011;29(36):4781‐4788. [DOI] [PubMed] [Google Scholar]
- 14. Fukuhisa H, Seki N, Idichi T, et al. Gene regulation by antitumor miR‐130b‐5p in pancreatic ductal adenocarcinoma: the clinical significance of oncogenic EPS8. J Hum Genet. 2019;64(6):521‐534. [DOI] [PubMed] [Google Scholar]
- 15. Zhang HD, Jiang LH, Sun DW, Li J, Ji ZL. The role of miR‐130a in cancer. Breast Cancer. 2017;24(4):521‐527. [DOI] [PubMed] [Google Scholar]
- 16. Guo Y, Yao B, Zhu Q, et al. MicroRNA‐301b‐3p contributes to tumour growth of human hepatocellular carcinoma by repressing vestigial like family member 4. J Cell Mol Med. 2019;23(8):5037‐5047. [DOI] [PMC free article] [PubMed] [Google Scholar]
- 17. Li X, Zhong M, Wang J, et al. miR‐301a promotes lung tumorigenesis by suppressing Runx3. Mol Cancer. 2019;18(1):99. [DOI] [PMC free article] [PubMed] [Google Scholar]
- 18. Hirono T, Jingushi K, Nagata T, et al. MicroRNA‐130b functions as an oncomiRNA in non‐small cell lung cancer by targeting tissue inhibitor of metalloproteinase‐2. Sci Rep. 2019;9(1):6956. [DOI] [PMC free article] [PubMed] [Google Scholar]
- 19. Wang L, Ji F, Liu G, et al. Upregulation of circulating miR130a is correlated with development of Barrett's esophagus and esophageal adenocarcinoma. OncoTargets Ther. 2019;12:1‐7. [DOI] [PMC free article] [PubMed] [Google Scholar]
- 20. Wei H, Cui R, Bahr J, et al. miR‐130a Deregulates PTEN and Stimulates Tumor Growth. Cancer Res. 2017;77(22):6168‐6178. [DOI] [PMC free article] [PubMed] [Google Scholar]
- 21. Egawa H, Jingushi K, Hirono T, et al. The miR‐130 family promotes cell migration and invasion in bladder cancer through FAK and Akt phosphorylation by regulating PTEN. Sci Rep. 2016;6:20574. [DOI] [PMC free article] [PubMed] [Google Scholar]
- 22. Pfaffl MW. A new mathematical model for relative quantification in real‐time RT‐PCR. Nucleic Acids Res. 2001;29(9):e45. [DOI] [PMC free article] [PubMed] [Google Scholar]
- 23. Dweep H, Gretz N. miRWalk2.0: a comprehensive atlas of microRNA‐target interactions. Nat Methods. 2015;12(8):697. [DOI] [PubMed] [Google Scholar]
- 24. Kuleshov MV, Jones MR, Rouillard AD, et al. Enrichr: a comprehensive gene set enrichment analysis web server 2016 update. Nucleic Acids Res. 2016;44(W1):W90‐97. [DOI] [PMC free article] [PubMed] [Google Scholar]
- 25. Tao J, Yang X, Li P, et al. Identification of circulating microRNA signatures for upper tract urothelial carcinoma detection. Mol Med Rep. 2015;12(5):6752‐6760. [DOI] [PMC free article] [PubMed] [Google Scholar]
- 26. Du M, Shi D, Yuan L, et al. Circulating miR‐497 and miR‐663b in plasma are potential novel biomarkers for bladder cancer. Sci Rep. 2015;5:10437. [DOI] [PMC free article] [PubMed] [Google Scholar]
- 27. Motawi TK, Rizk SM, Ibrahim TM, Ibrahim IA. Circulating microRNAs, miR‐92a, miR‐100 and miR‐143, as non‐invasive biomarkers for bladder cancer diagnosis. Cell Biochem Func. 2016;34(3):142‐148. [DOI] [PubMed] [Google Scholar]
- 28. Usuba W, Urabe F, Yamamoto Y, et al. Circulating miRNA panels for specific and early detection in bladder cancer. Cancer Sci. 2019;110(1):408‐419. [DOI] [PMC free article] [PubMed] [Google Scholar]
- 29. Jiang X, Du L, Wang L, et al. Serum microRNA expression signatures identified from genome‐wide microRNA profiling serve as novel noninvasive biomarkers for diagnosis and recurrence of bladder cancer. Int J Cancer. 2015;136(4):854‐862. [DOI] [PubMed] [Google Scholar]
- 30. Armstrong DA, Green BB, Seigne JD, Schned AR, Marsit CJ. MicroRNA molecular profiling from matched tumor and bio‐fluids in bladder cancer. Mol Cancer. 2015;14:194. [DOI] [PMC free article] [PubMed] [Google Scholar]
- 31. Pritchard CC, Kroh E, Wood B, et al. Blood cell origin of circulating microRNAs: a cautionary note for cancer biomarker studies. Cancer Prev Res. 2012;5(3):492‐497. [DOI] [PMC free article] [PubMed] [Google Scholar]
- 32. Tolle A, Blobel CC, Jung K. Circulating miRNAs in blood and urine as diagnostic and prognostic biomarkers for bladder cancer: an update in 2017. Biomarkers Med. 2018;12(6):667‐676. [DOI] [PubMed] [Google Scholar]
- 33. Hamilton MP, Rajapakshe K, Hartig SM, et al. Identification of a pan‐cancer oncogenic microRNA superfamily anchored by a central core seed motif. Nat Commun. 2013;4:2730. [DOI] [PMC free article] [PubMed] [Google Scholar]
- 34. Liu Y, Li Y, Wang R, et al. MiR‐130a‐3p regulates cell migration and invasion via inhibition of Smad4 in gemcitabine resistant hepatoma cells. J Exp Clin Cancer Res. 2016;35:19. [DOI] [PMC free article] [PubMed] [Google Scholar]
- 35. Lee SH, Jung YD, Choi YS, Lee YM. Targeting of RUNX3 by miR‐130a and miR‐495 cooperatively increases cell proliferation and tumor angiogenesis in gastric cancer cells. Oncotarget. 2015;6(32):33269‐33278. [DOI] [PMC free article] [PubMed] [Google Scholar]
- 36. Wang Y, Zhang X, Tang W, et al. miR‐130a upregulates mTOR pathway by targeting TSC1 and is transactivated by NF‐kappaB in high‐grade serous ovarian carcinoma. Cell Death Differ. 2017;24(12):2089‐2100. [DOI] [PMC free article] [PubMed] [Google Scholar]
- 37. Dong P, Karaayvaz M, Jia N, et al. Mutant p53 gain‐of‐function induces epithelial‐mesenchymal transition through modulation of the miR‐130b‐ZEB1 axis. Oncogene. 2013;32(27):3286‐3295. [DOI] [PMC free article] [PubMed] [Google Scholar]
- 38. Lu Z, Li Y, Takwi A, et al. miR‐301a as an NF‐kappaB activator in pancreatic cancer cells. EMBO J. 2011;30(1):57‐67. [DOI] [PMC free article] [PubMed] [Google Scholar]
- 39. Zhang L, Zhang Y, Zhu H, et al. Overexpression of miR‐301a‐3p promotes colorectal cancer cell proliferation and metastasis by targeting deleted in liver cancer‐1 and runt‐related transcription factor 3. J Cell Biochem. 2019;120(4):6078‐6089. [DOI] [PubMed] [Google Scholar]


