
FIGURE 3.
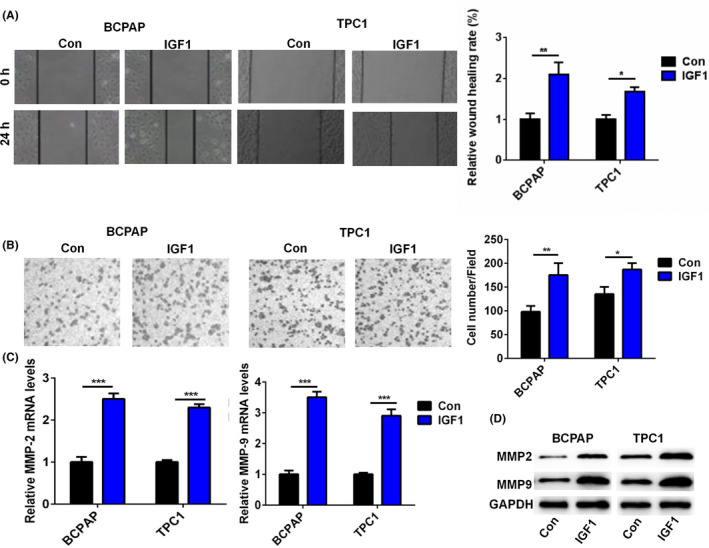
IGF1 treatment promoted cell invasion of BCPAP and TPC1 cells. A, The wound healing rate of BCPAP and TPC1 cells after treatment with IGF1 (10 ng) was analyzed. One representative image from three separate experiments is shown (original magnification 40×). B, The cell invasive capacity of BCPAP and TPC1 cells after treatment with IGF1 (10 ng) was analyzed by transwell invasion assay. One representative image from three separate experiments is shown (original magnification 40×). C, The relative mRNA level of MMP‐2 and MMP‐9 in BCPAP and TPC1 cells after treatment with IGF1 (10 ng) was analyzed by qRT‐PCR. D, The protein level of MMP‐2 and MMP‐9 in BCPAP and TPC1 cells after treatment with IGF1 (10 ng) was analyzed by Western blot.*P < .05, **P < .01, ***P < .001