
FIGURE 4.
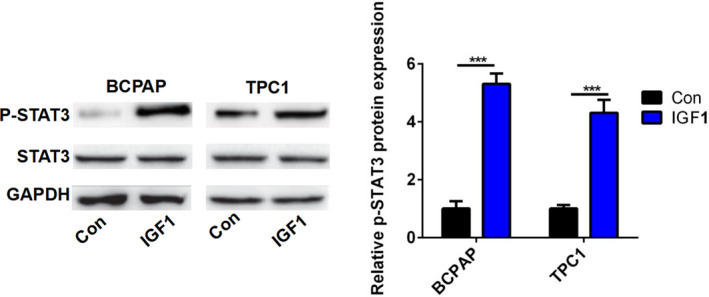
IGF1 activated the STAT3 pathway. The protein level of p‐STAT3 and STAT3 in BCPAP and TPC1 cells after treatment with IGF1 (10 ng) was analyzed by Western blot. The band density was analyzed using ImageJ. ***P < .001
Official websites use .gov
A
.gov website belongs to an official
government organization in the United States.
Secure .gov websites use HTTPS
A lock (
) or https:// means you've safely
connected to the .gov website. Share sensitive
information only on official, secure websites.
IGF1 activated the STAT3 pathway. The protein level of p‐STAT3 and STAT3 in BCPAP and TPC1 cells after treatment with IGF1 (10 ng) was analyzed by Western blot. The band density was analyzed using ImageJ. ***P < .001