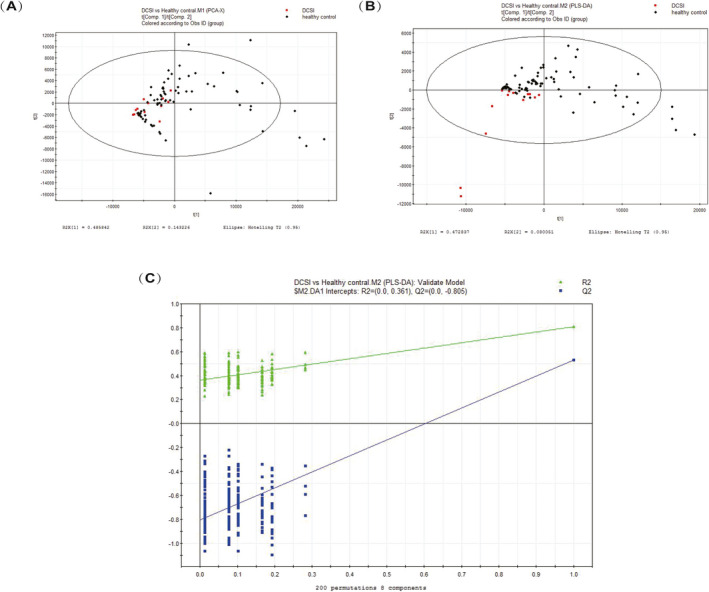
FIGURE 1.

A, PCA score plot. B,: PLS‐DA score plot (eight components, R2X = 0.868; R2Y = 0.806; Q2 = 0.531). C, PLS‐DA validation plot intercepts: R2 = (0.0, 0.031); Q2 = (0.0, −0.805)

A, PCA score plot. B,: PLS‐DA score plot (eight components, R2X = 0.868; R2Y = 0.806; Q2 = 0.531). C, PLS‐DA validation plot intercepts: R2 = (0.0, 0.031); Q2 = (0.0, −0.805)