
FIGURE 5.
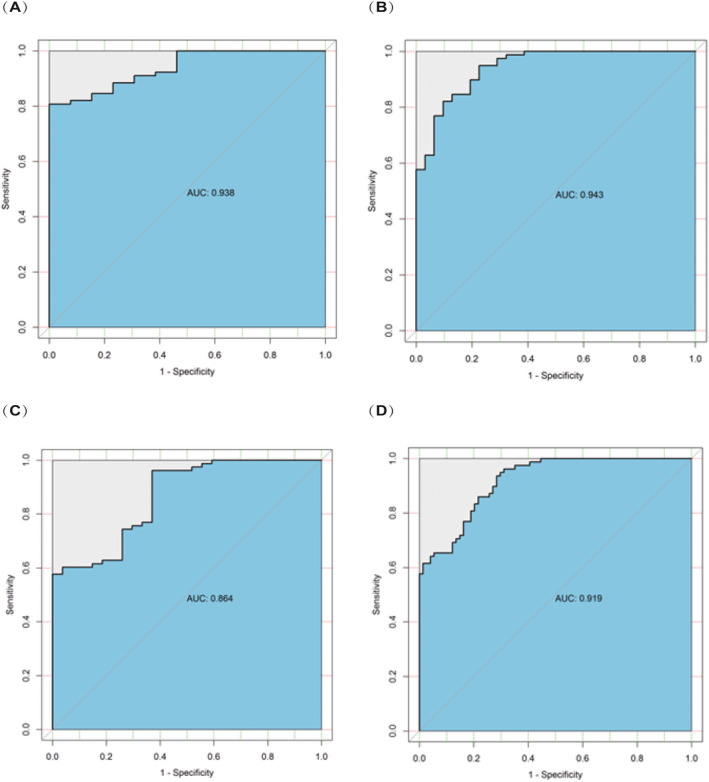
A, The ROC curve of healthy controls vs DCIS patients obtained by using the combination of seven biomarkers. B, The ROC curve of healthy controls vs lymph node‐negative breast cancer patients obtained by using the combination of seven biomarkers. C, The ROC curve of healthy controls vs lymph node‐positive breast cancer patients obtained by using the combination of seven biomarkers. D, The ROC curve of healthy controls vs breast cancer patients obtained by using the combination of seven biomarkers