
FIGURE 3.
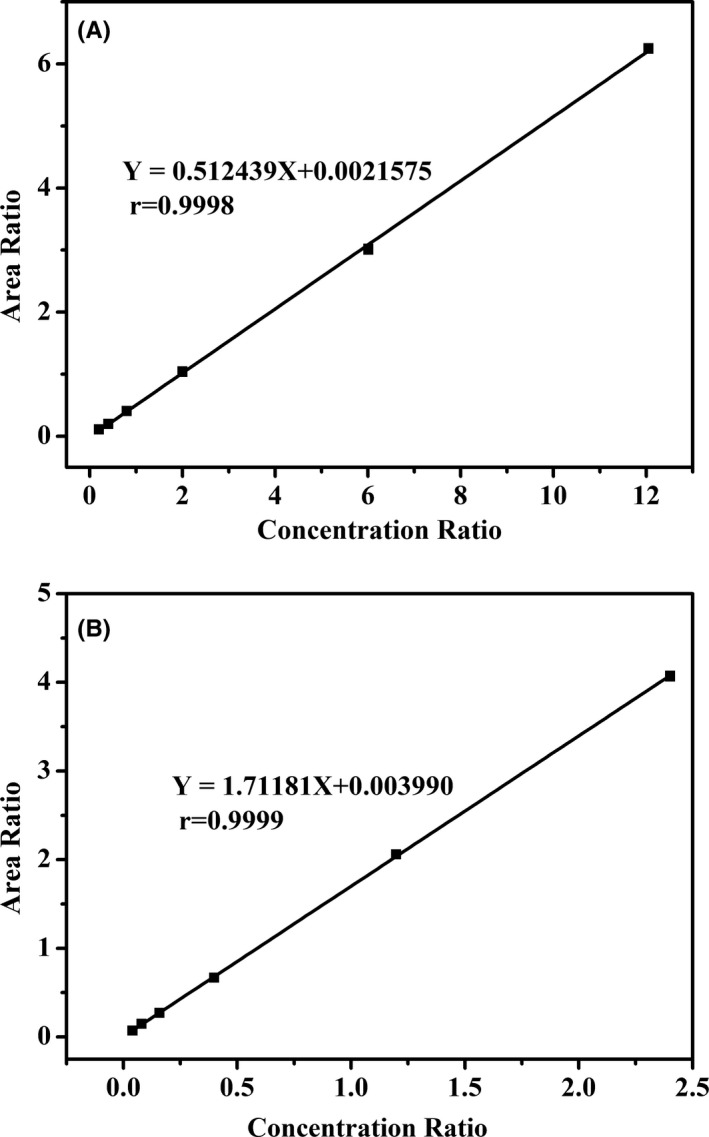
Representative calibration curve for vitamin A (A) and vitamin E (B), all correlation coefficient values were greater than 0.99
Official websites use .gov
A
.gov website belongs to an official
government organization in the United States.
Secure .gov websites use HTTPS
A lock (
) or https:// means you've safely
connected to the .gov website. Share sensitive
information only on official, secure websites.
Representative calibration curve for vitamin A (A) and vitamin E (B), all correlation coefficient values were greater than 0.99