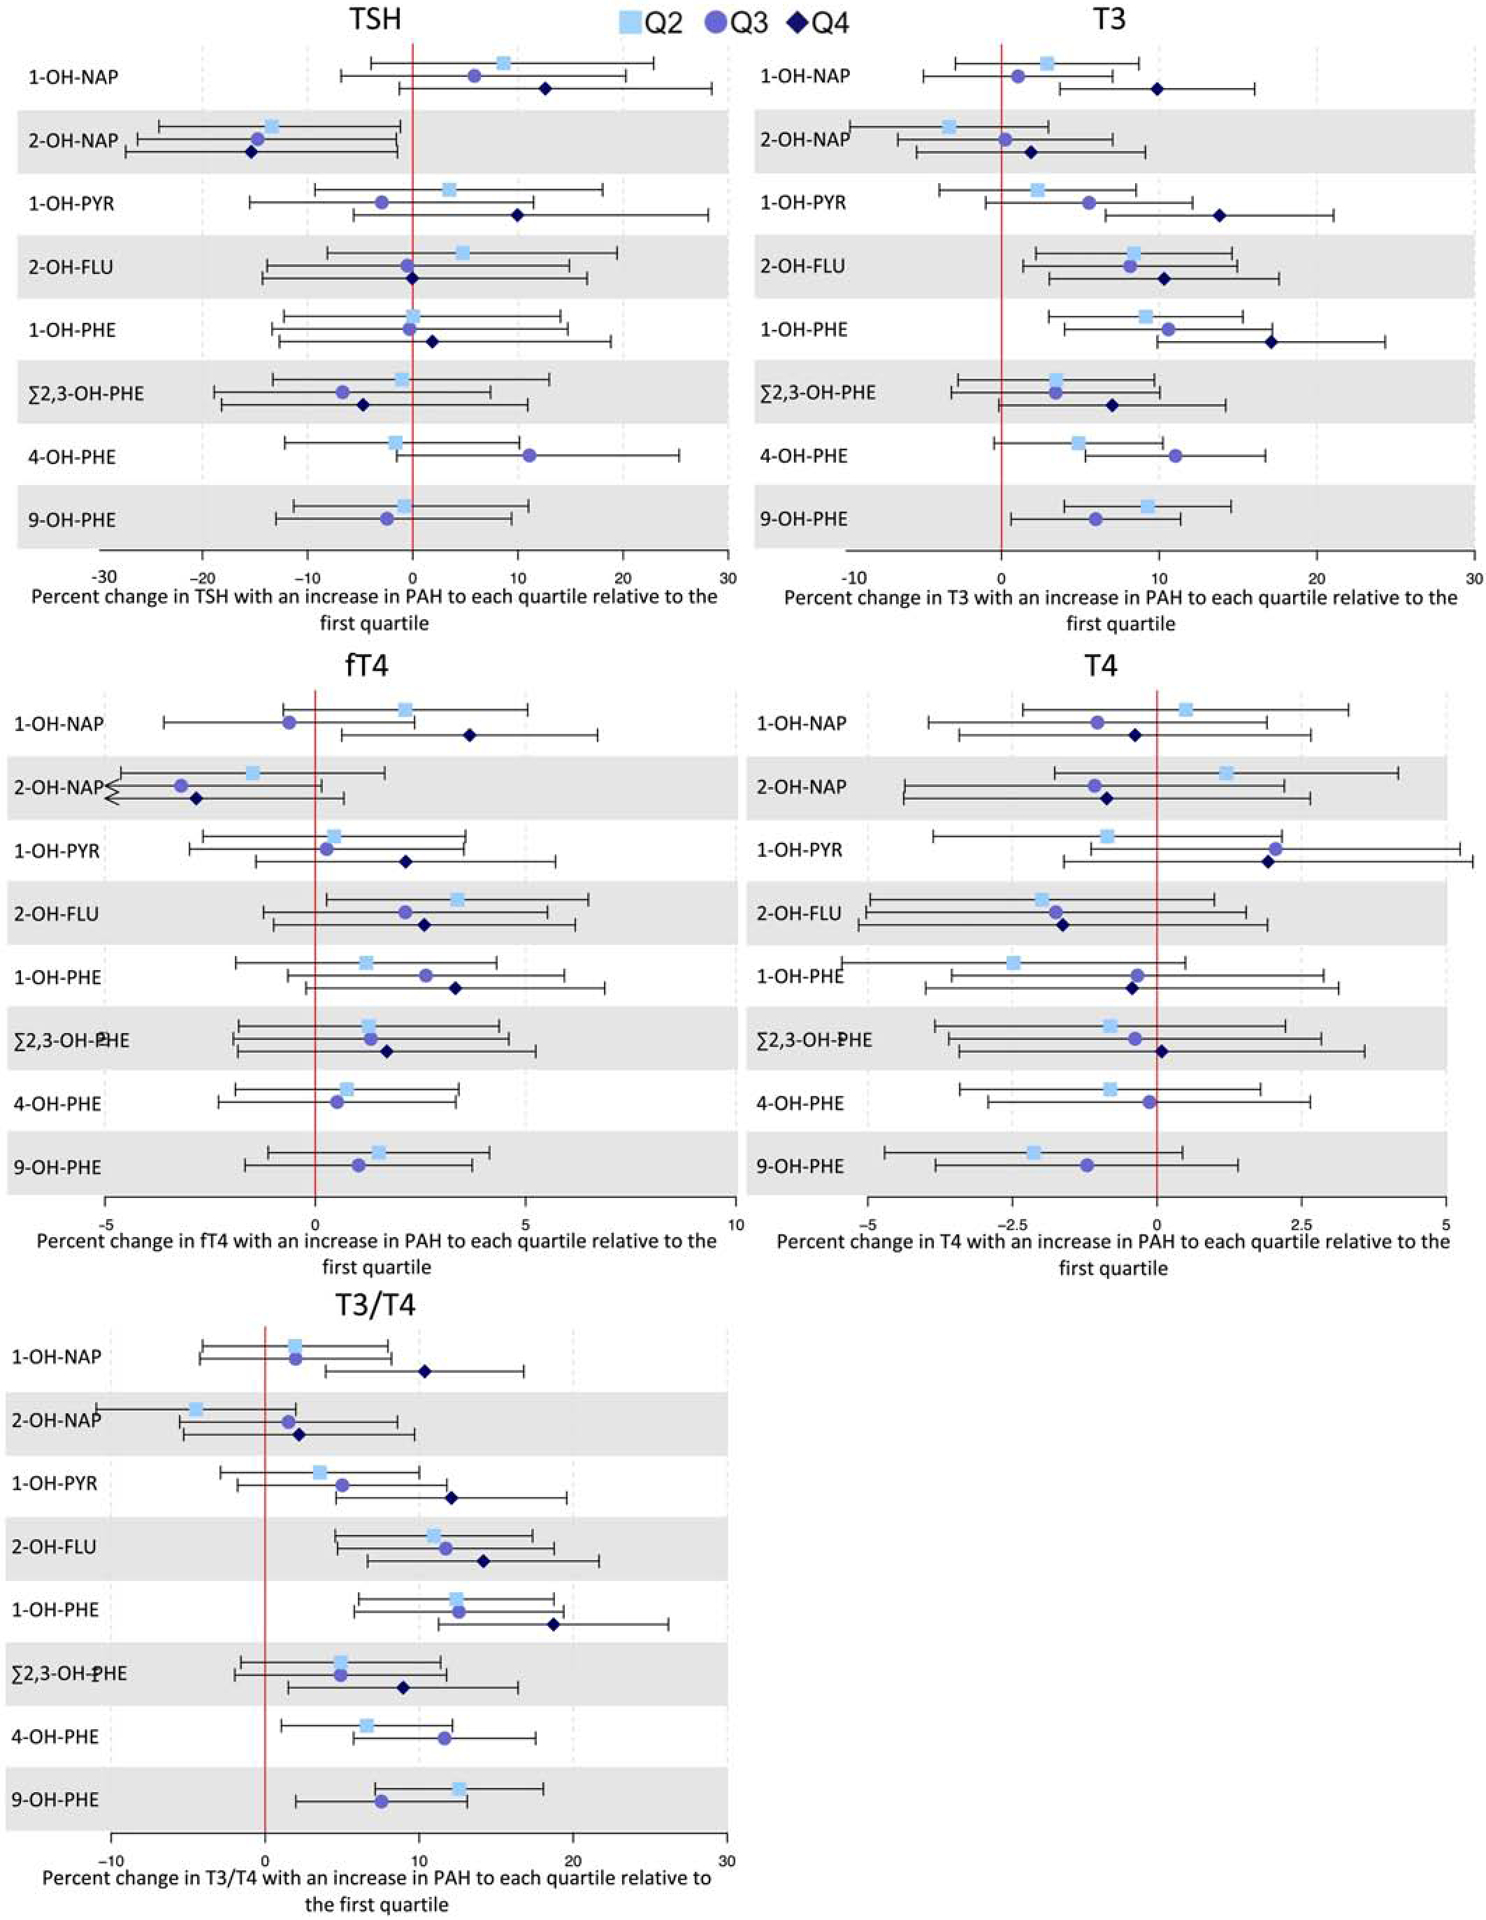
Figure 2:

Forest plot depicting percent changes (colored points) and 95% confidence intervals (bars) of thyroid hormones with increases from the first quartile of PAH metabolite concentration to higher quartiles. Arrows indicate that the confidence interval extends beyond the bounds of the plot.
*Reference category corresponds to PAH metabolite concentrations measured below the LOD. Among PAH measurements above the LOD, the boxes are estimates corresponding to PAH concentrations at or below the median, and the circles are estimates corresponding to concentrations above the median.
