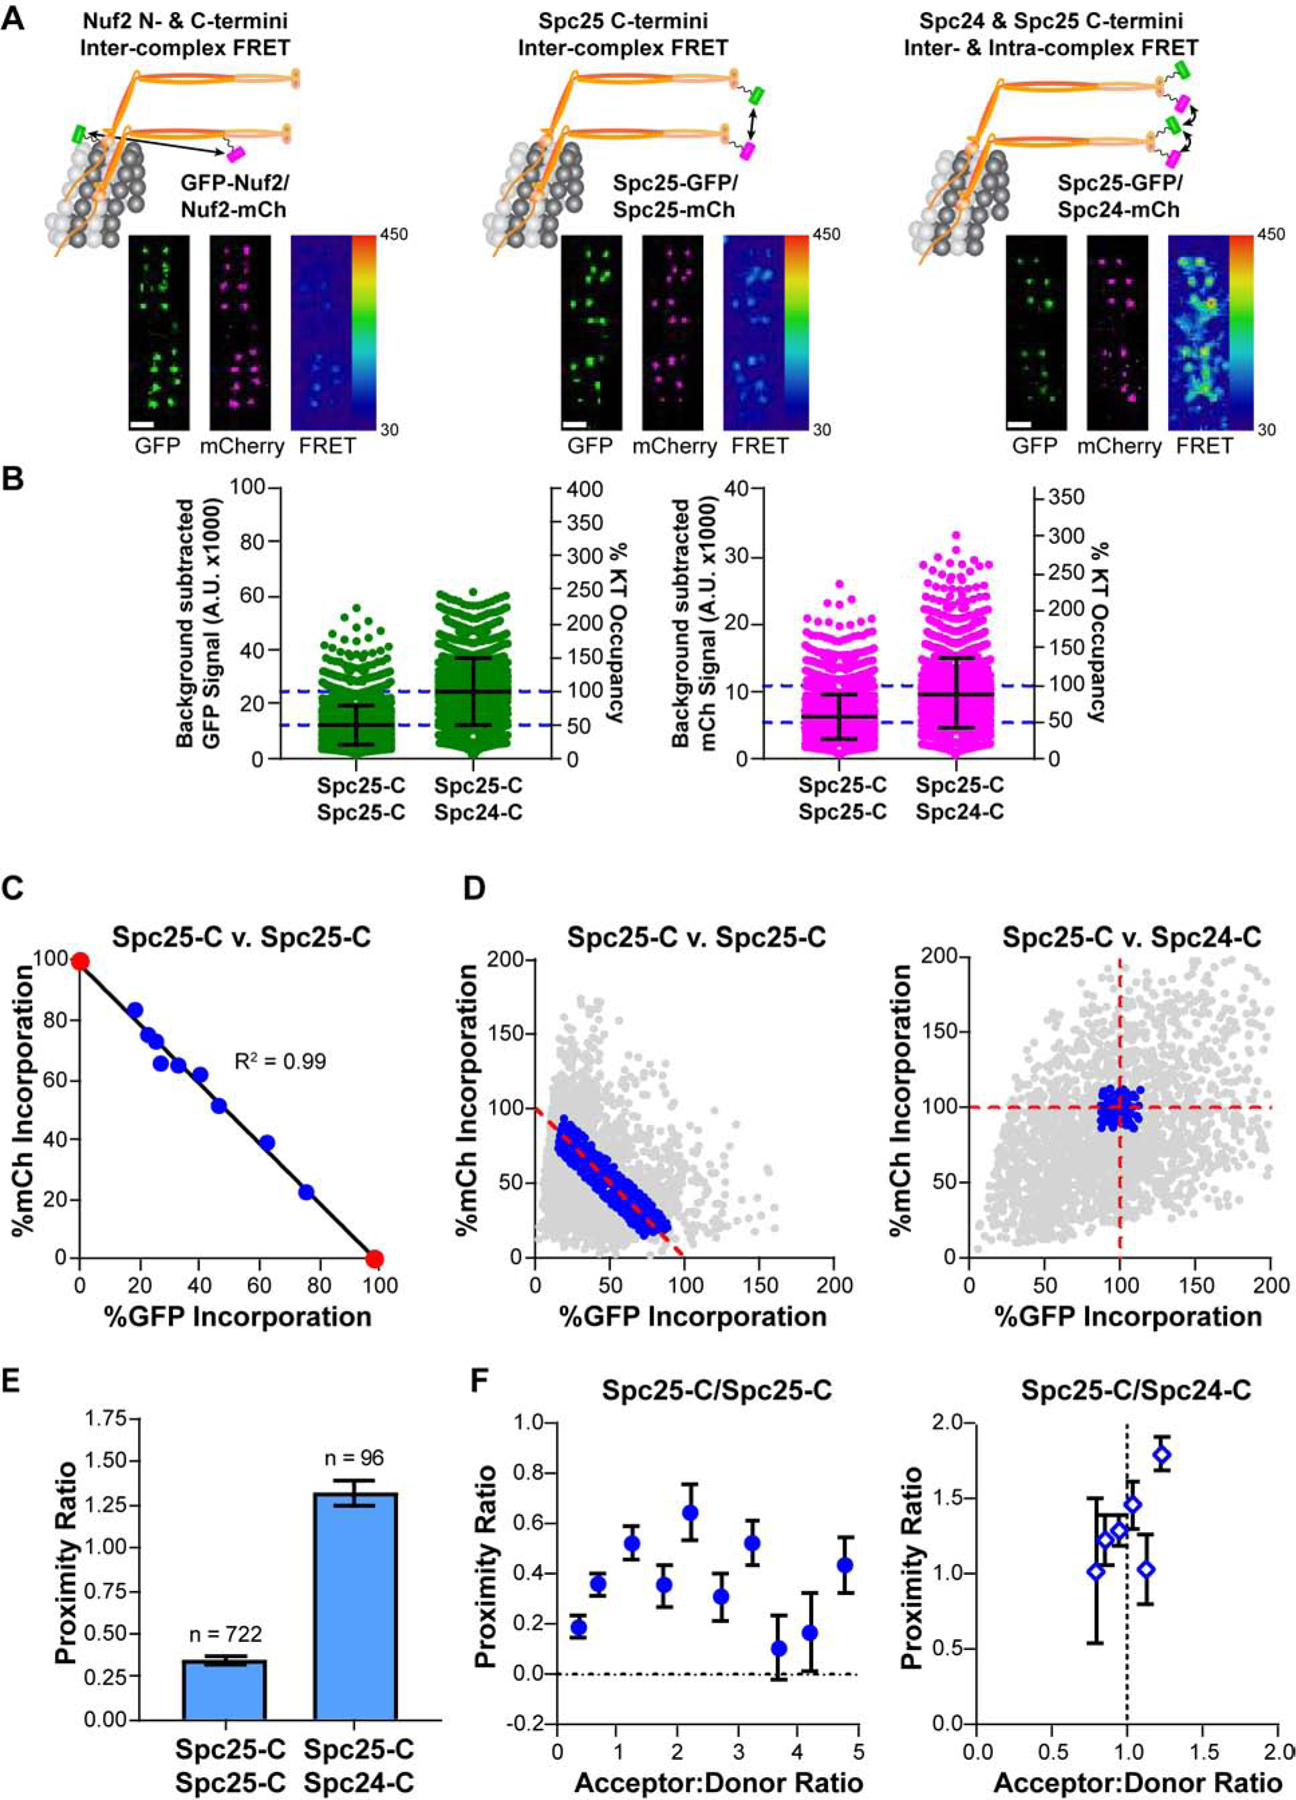
Figure 1. Design and implementation of a FRET imaging strategy to study kinetochore architecture.

A) Top: Co-expression of GFP (FRET donor, green) and mCherry (mCh, FRET acceptor, magenta) fusions of the Ndc80 complex (Ndc80C, orange) reveal the proximity between adjacent Ndc80C molecules along the longitudinal axis (left), around the circumference of the microtubule (middle, right). For simplicity, only two Ndc80C molecules per microtubule are shown. Micrographs show representative metaphase plates from each cell line. FRET micrographs are scaled equivalently and pseudo-colored by the raw FRET values; GFP and mCherry micrographs are scaled for ease of viewing. Scale bar, 1 μm B) Background subtracted GFP and mCherry signals of individual kinetochores in cells expressing Spc25-GFP/Spc25-mCherry and Spc25-GFP/Spc24-mCherry after siRNA-mediated knockdown of endogenous Spc25 or both Spc25 and Spc24, respectively. The Y axis on the right shows the saturation level of the kinetochore by the GFP- and mCherry labeled subunit, estimated from [11] C) Correlation between Spc25-GFP and Spc25-mCherry signals measured from kinetochores from the data set in B. Data were binned by the ratio of mCherry to GFP fluorescence, and further normalized by the X- and Y-intercepts of their linear regression (black line; see main text). Measurements of cells expressing Spc25-GFP or Spc25-mCherry in isolation are marked by red circles. From left to right: n = 398, 379, 109, 108, 131, 145, 170, 212, 491, 320, 499. D) Normalized fluorescence signals for all kinetochores measured in Spc25-C/Spc25-C (left) and Spc25-C/Spc24-C (right) expressing cells. Only the data indicating complete saturation of the kinetochore by fluorophore-labeled proteins (blue circles) were used to measure FRET. Kinetochores from Spc25-C/Spc25-C expressing cells were further filtered by their acceptor to donor ratios (A:D) to include only the data within the range of 0.2 – 5 (see STAR Methods). All other values are excluded (gray circles) E) The proximity ratio for fully occupied, metaphase kinetochores in Spc25-C/Spc25-C and in Spc25-C/Spc24-C expressing cells. The number of kinetochores measured for each cell line is indicated above the bars. F) Dependence of the proximity ratio on the A:D. In the absence of competition, the proximity ratio clusters around an A:D that reflects the inherent stoichiometry of the two fluorophore-labeled subunits involved (Spc25-C/Spc24-C cells, right). Data are binned by A:D (mean ± SEM; for Spc25-C/Spc25-C, n = 150, 192, 93, 62, 37, 53, 50, 36, 24, 25; for Spc25-C/Sp24-C, n = 2, 13, 32, 30, 14, 5). In B), error bars are ± S.D. In C), E), and F) data represent the mean ± SEM In C), SEM error bars are too small to be seen. Data collected in B) - F) are from N ≥ 3 experiments. See also Figures S1 and S2, and Table S1.
