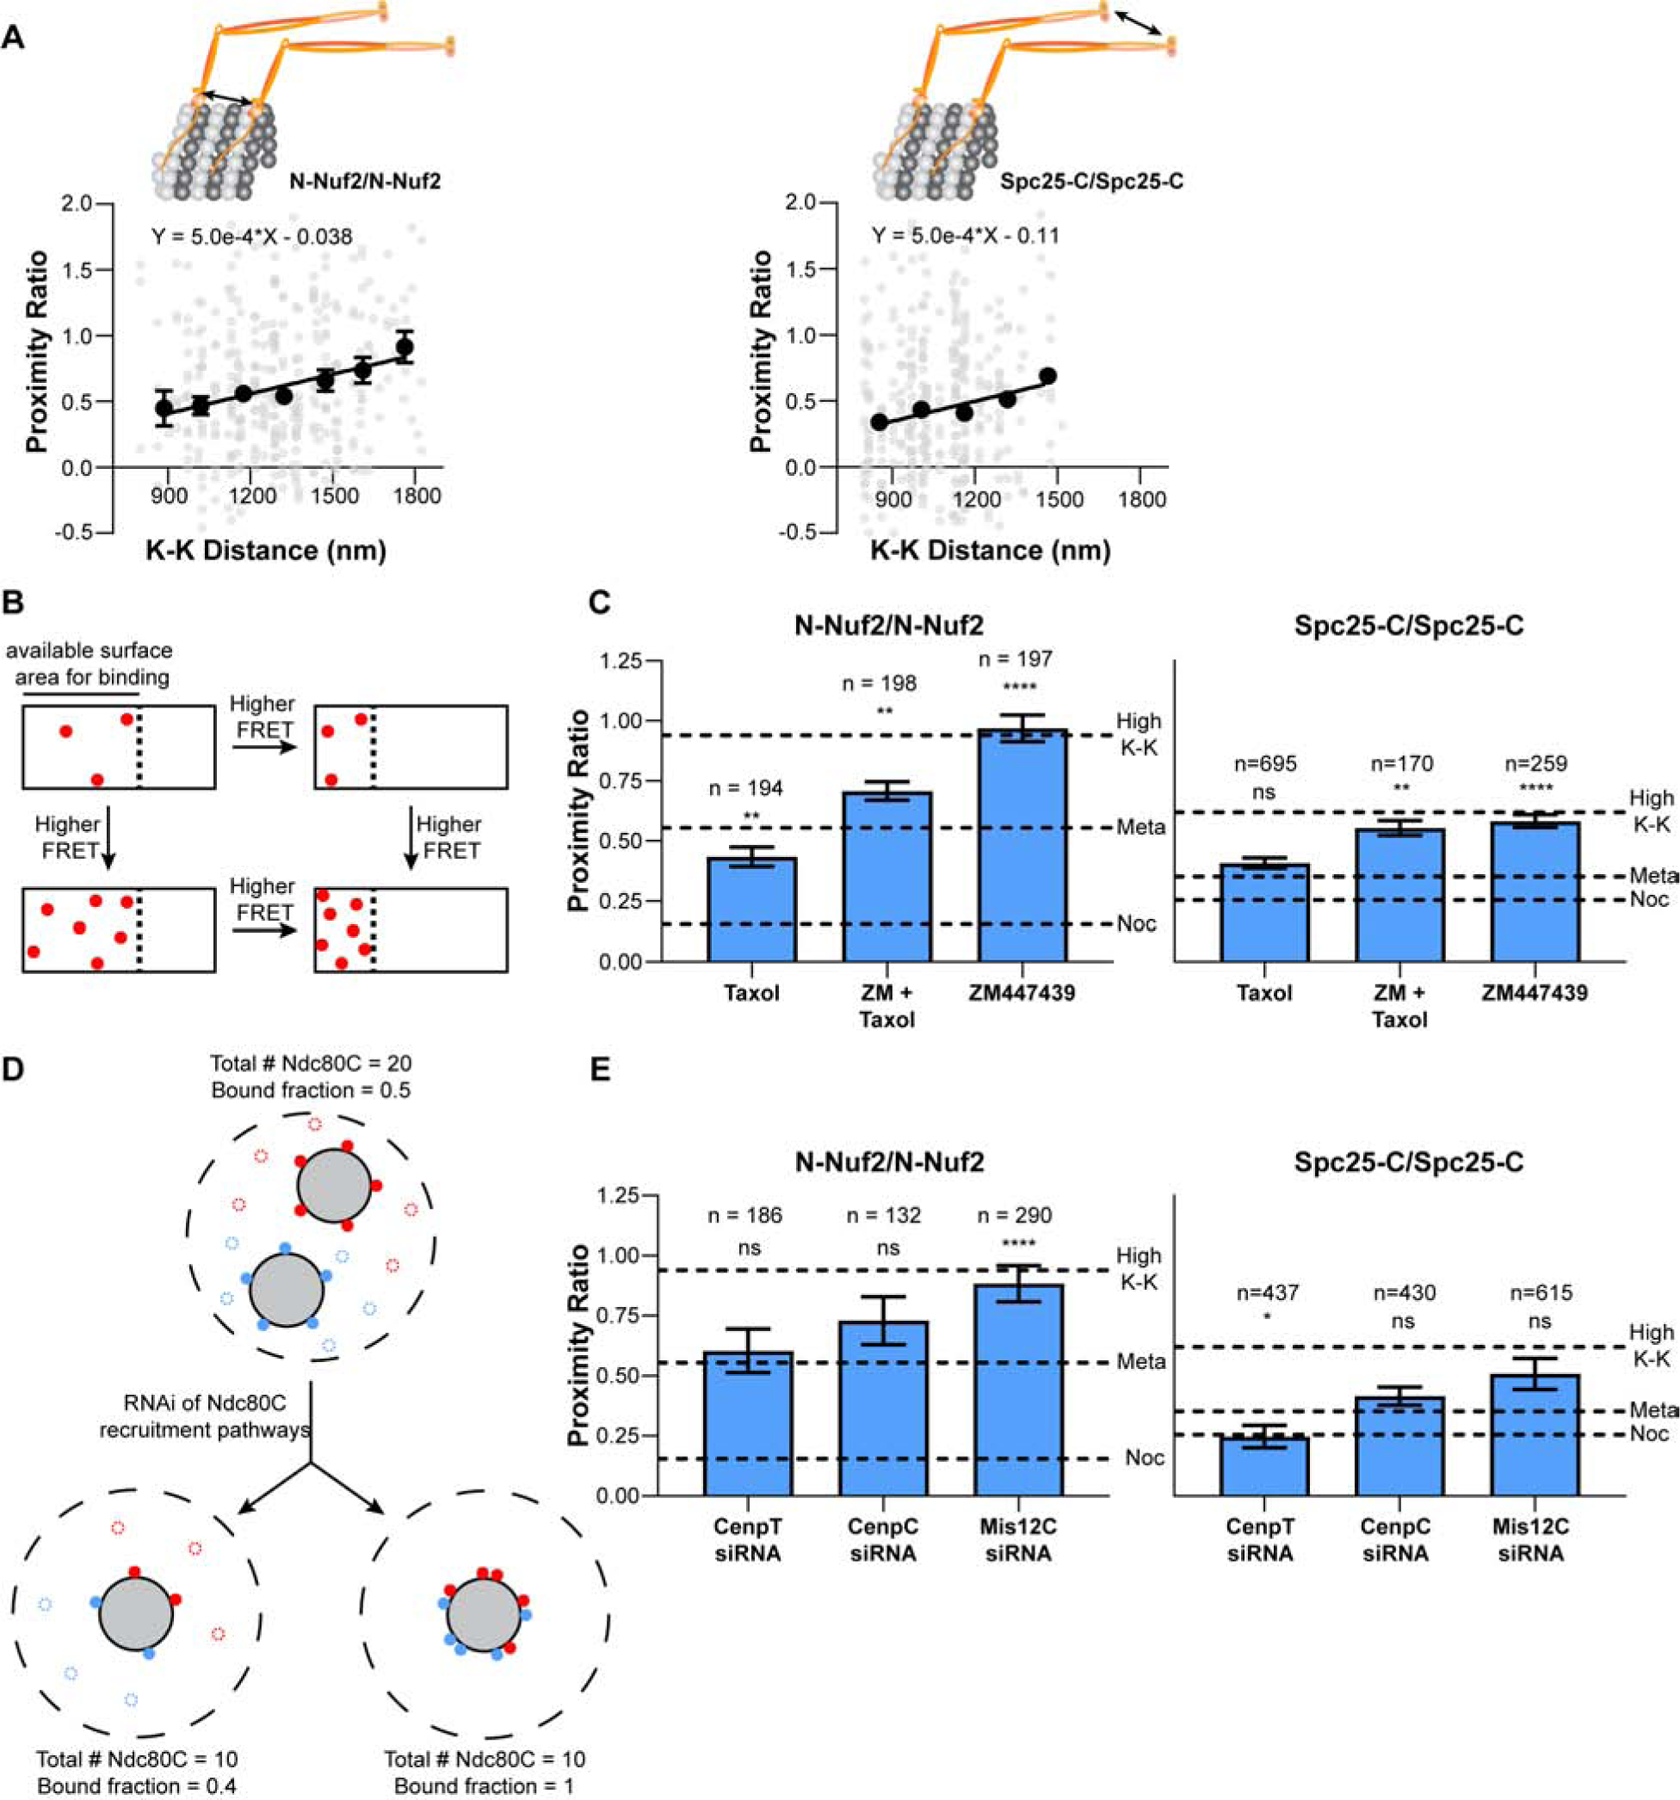
Figure 5. Centromeric tension and microtubule dynamics promote Ndc80C clustering.

A) Correlation between the proximity ratio and sister kinetochore separation in metaphase for N-Nuf2/N-Nuf2 (left) and Spc25-C/Spc25-C (right) Proximity ratio measurements from fully occupied, metaphase kinetochores in either N-Nuf2/N-Nuf2 (left) or Spc25-C/Spc25-C (right). The unbinned data are in gray and the average value of each bin is shown in black. Bins were defined in ranges of 150 nm K-K distance and are the mean ± SEM. For N-Nuf2/N-Nuf2, n = 23, 52, 92, 83, 63, 30, 20 kinetochores; Pearson correlation coefficient = 0.17 for the unbinned data. For Spc25-C/Spc25-C, n = 82, 103, 108, 41, 14 kinetochores; Pearson correlation coefficient = 0.09 for the unbinned data. Solid line - linear regression. B) The diagram depicts the relationship between the binding density of Ndc80C and the FRET produced by a kinetochore. White rectangles represent the microtubule lattice, where the dashed line demarcates the region of the microtubule plus-end available for Ndc80C binding. Red dots represent bound Ndc80C molecules. C) N-Nuf2/N-Nuf2 and Spc25-C/Spc25-C FRET in response to the microtubule-stabilizing drug Taxol, the Aurora B kinase inhibitor ZM447439, or both. D) Cartoon depicting two potential effects of siRNA-mediated knockdown of Ndc80C recruitment pathways on the organization of Ndc80C molecules. The dashed outer circle denotes the entire kinetochore in an en face view. Blue and red circles indicate Ndc80C molecules linked to individual CenpA nucleosomes. Filled circles are molecules bound to microtubules (grey circles). Unfilled circles indicate unbound molecules. E) N-Nuf2/N-Nuf2 and Spc25-C/Spc25-C FRET after siRNA mediated knockdown of members of the Ndc80C recruitment pathways. In C) and E) data are the average proximity ratio ± SEM. The dashed lines indicate the average proximity ratio for untreated metaphase (Meta), nocodazole-treated (Noc), and for high tension kinetochores (High K-K). The number of kinetochores measured is indicated above the bars. All data are from N ≥ 3 experiments. Statistical significance between untreated, metaphase cells and each of the measurements in C) and E) was evaluated by the Mann Whitney test, ns = not significant; * = p<0.05; ** = p<0.01; *** = p<0.001; **** = p<0.0001. See also Figure S6 and Table S1.
