
Extended Data Fig. 7. Representative electron density.
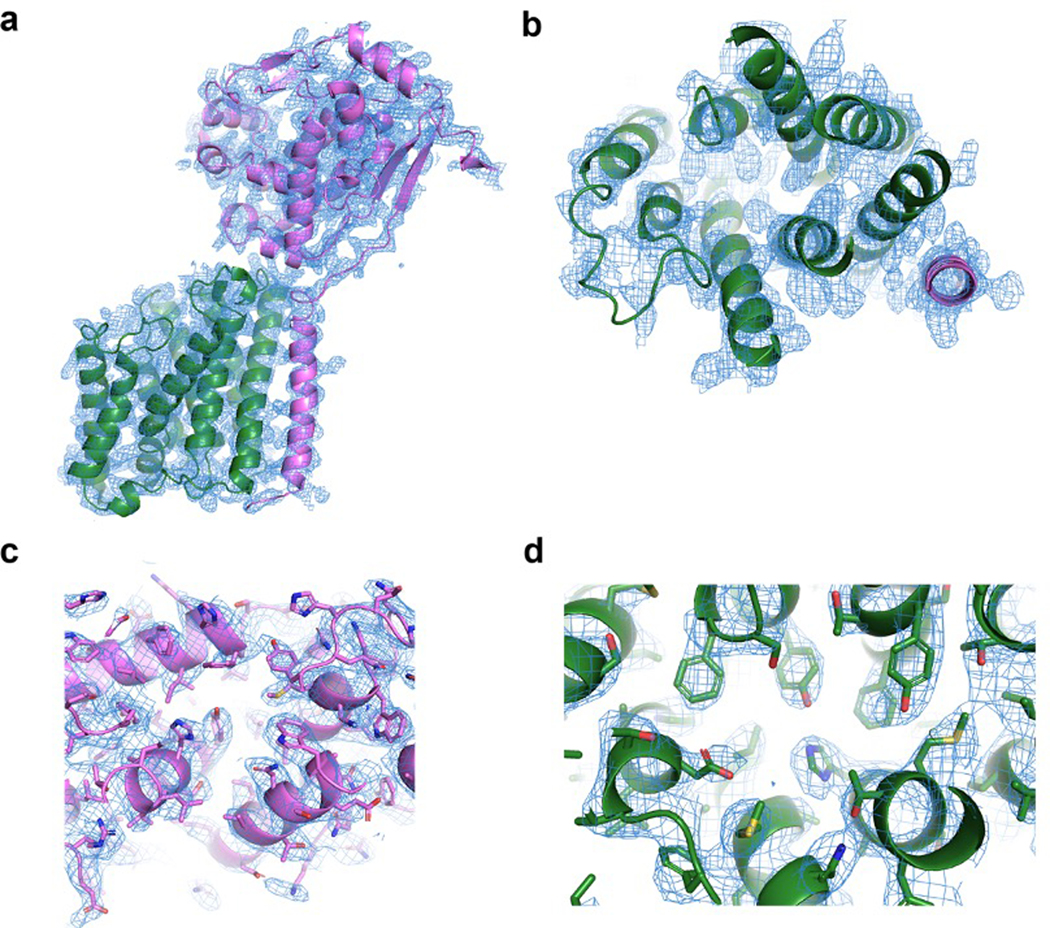
a-d, Simulated-annealing composite omit 2FO-FC electron density maps contoured at 1σ and carved 1.6Å from the model, with SagB colored violet and SpdC colored green. a, Overall structure of SagB-SpdC viewed in the plane of the membrane. b, View of the transmembrane helices from the extracellular face. c, Active site groove of SagB, with sidechains shown as sticks. d, Central region of SpdC between several transmembrane helices in the same orientation as shown in b.