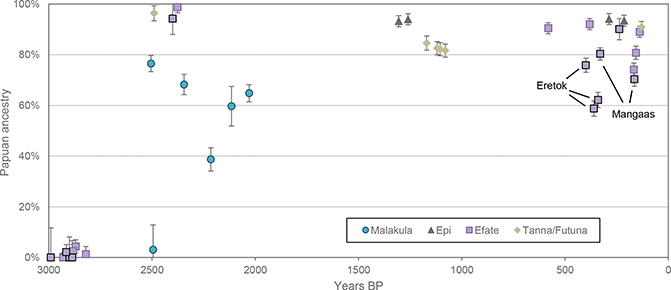
Figure 3. Ancestry proportions for ancient Vanuatu individuals.
Results are from two-component qpAdm models estimating total proportions of Papuan and FRO ancestry, truncated at 0% for four individuals with negative point estimates. Newly reported individuals are represented by points with black outlines. Some points are shifted slightly left and right for legibility. Bars show two standard errors in both directions (for truncated individuals, upper limit of point estimate plus two standard errors). See Table 1 for full date intervals and Data S1D for full qpAdm results.

