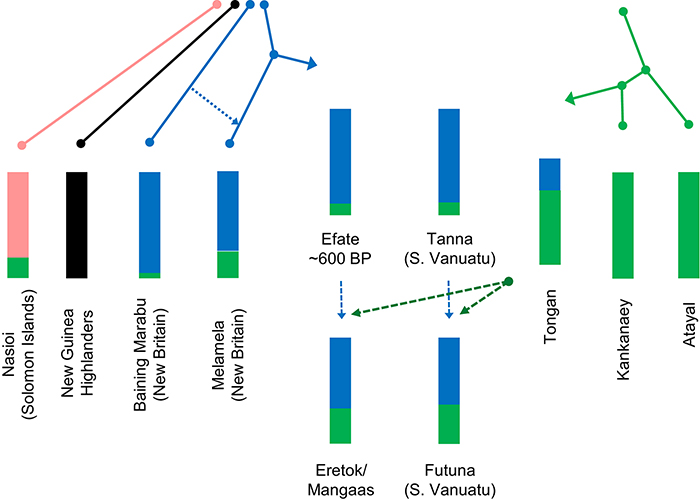
Figure 5. Schematic of admixture graph results.
Inferred phylogeny is shown for FRO-related ancestry (light green) and four Papuan lineages (pink, black, and blue, shown separately because they are not related by a simple tree). Arrows denote Papuan ancestry found in Vanuatu and Polynesia (solid blue), admixed FRO ancestry (green), local Ni-Vanuatu ancestry (dashed blue), Polynesian-related ancestry (dashed dark green), and intra-New Britain admixture (dotted blue). Colored bars give inferred total ancestry proportions (excluding outgroups Australian and Mixe). See Figure S5 for full results. S., southern.

