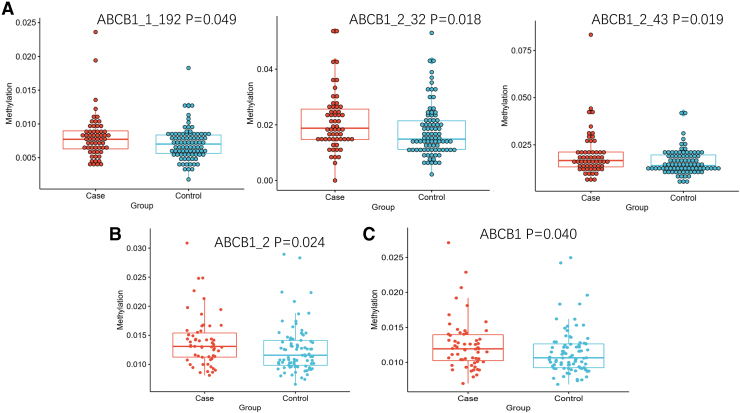
FIG. 3.
Scatter diagram of methylation difference analysis. (A) The methylation difference analysis of CpG sites. ABCB1_1_192, ABCB1_2_32, and ABCB1_2_43 showing statistically significant differences (p < 0.05). (B) The methylation difference analysis of fragment. The ABCB1–2 fragment is significantly different between the steroid-induced ONFH group and steroid-resistant group (p = 0.024). (C) The methylation difference analysis of gene. The ABCB1 gene is significantly different between the steroid-induced ONFH group and steroid-resistant group (p = 0.040). Color images are available online.

