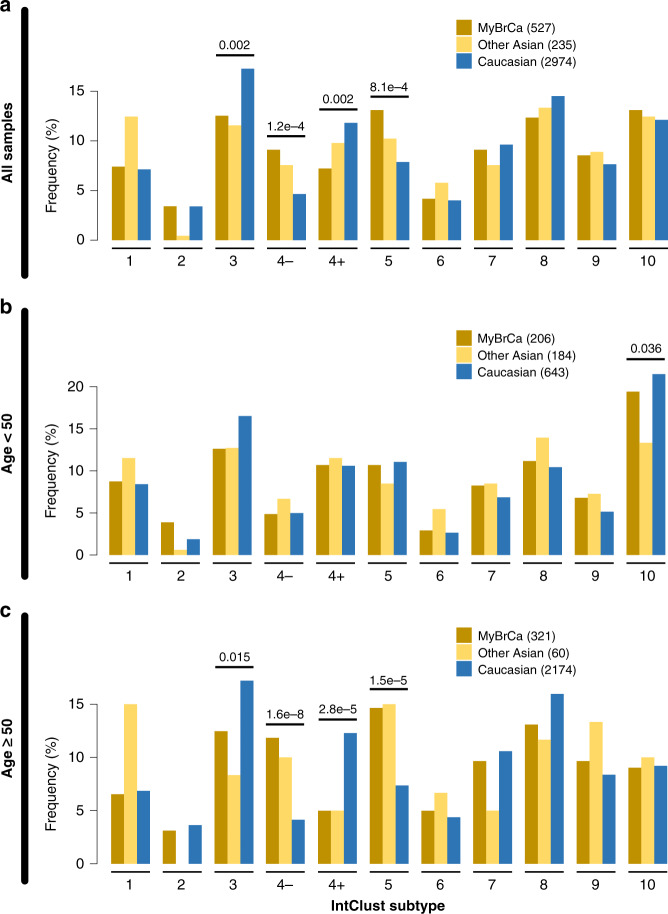
Fig. 1. Molecular subtypes of Malaysian breast cancer.
Comparison of Integrative Cluster molecular subtype distribution across Malaysian (MyBrCa), other Asian (Korean, TCGA Asian) and Caucasian (TCGA Caucasian, METABRIC, Nik-Zainal 201623) cohorts. Comparisons were done using the full cohorts a as well as with only patients below b or above c the age of 50. Numbers above the bars are p values denoting significant differences between Asians and Caucasians for that subtype, as determined by Pearson’s chi-square test. Numbers in the figure legend indicate sample size.

