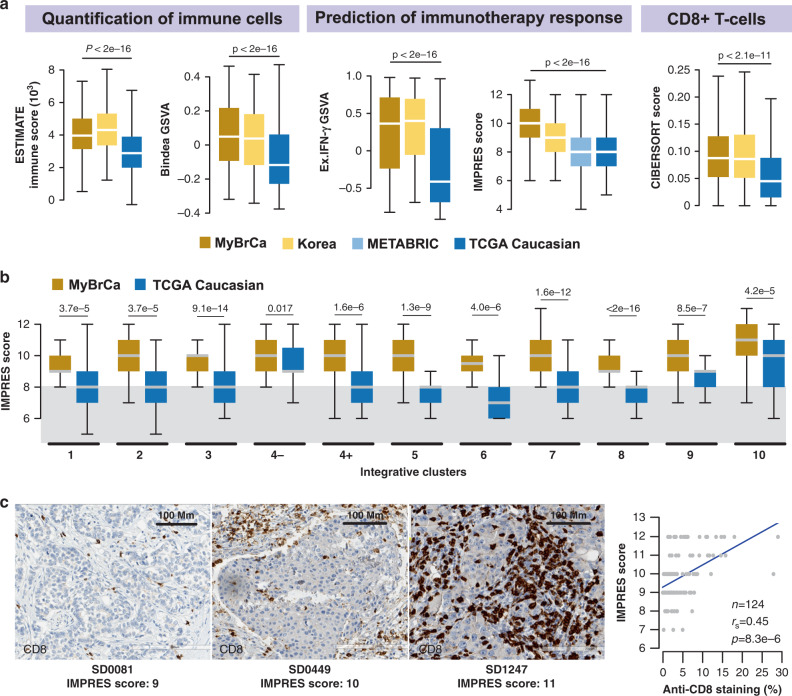
Fig. 3. The tumour immune microenvironment of Malaysian breast cancer.
a Comparison of the tumour immune microenvironment in breast tumours from the Malaysian (MyBrCa, n = 527), Korean (n = 168), METABRIC (MB, n = 997) and Caucasian TCGA (n = 638) cohorts across five quantification methods—from left to right: ESTIMATE immune scores, GSVA using Bindea et al.‘s (2013)31 combined immune gene set, GSVA using an expanded IFN-γ gene set (Ayers et al. 201732), IMPRES (Auslander et al. 201833) and CD8+ T-cell scores from CIBERSORT. Outliers not shown. P values indicated are for one-way ANOVA. b Breakdown of IMPRES scores across MyBrCa and TCGA cohorts by IntClust subtype. Grey area indicates the threshold (score = 8) used by Auslander et al.33 to separate high versus low scores. Outliers not shown. P values indicated are for two-sided student’s t tests. a–b The boxes in box plots indicate 25th percentile, median and 75th percentile, whereas whiskers show the maximum and minimum values within 1.5 times the inter-quartile range from the edge of the box. c Validation of tumour immune scores in the Malaysian cohort using IHC; representative images shown with staining for CD8 in brown. IHC experiments were repeated in 124 samples across a range of IMPRES scores, with the results summarised in the figure on the right. Right: correlation between percentage of cell stained with anti-CD8 by IHC versus IMPRES scores. P value shown is for Spearman’s correlation coefficient.

