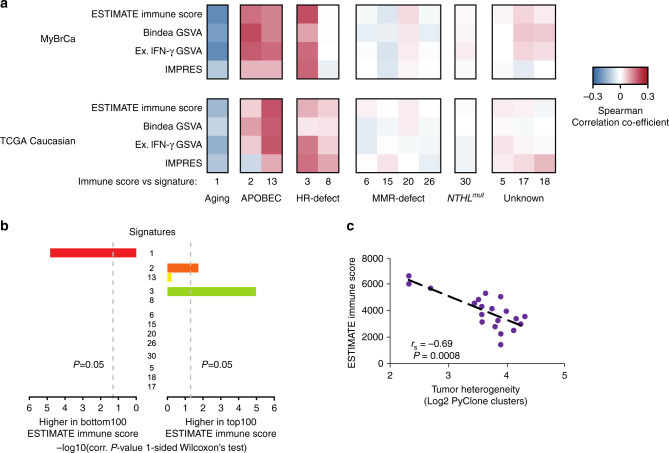
Fig. 4. Factors associated with immune scores.
a Heatmap depicting Spearman correlation of coefficient between mutation signatures in MyBrCa or TCGA Caucasian samples versus immune scores. b Bar plots depicting P values from one-sided Wilcoxon’s test of the top versus bottom quartile MyBrCa samples, ranked according to ESTIMATE scores. c Comparison of ESTIMATE immune scores to the tumour heterogeneity of each MyBrCa sample, quantified as the log2 of the number of clusters predicted by PyClone analysis. Samples were stratified into 20 groups according to ESTIMATE immune score. P value shown is for Spearman’s correlation coefficient.

