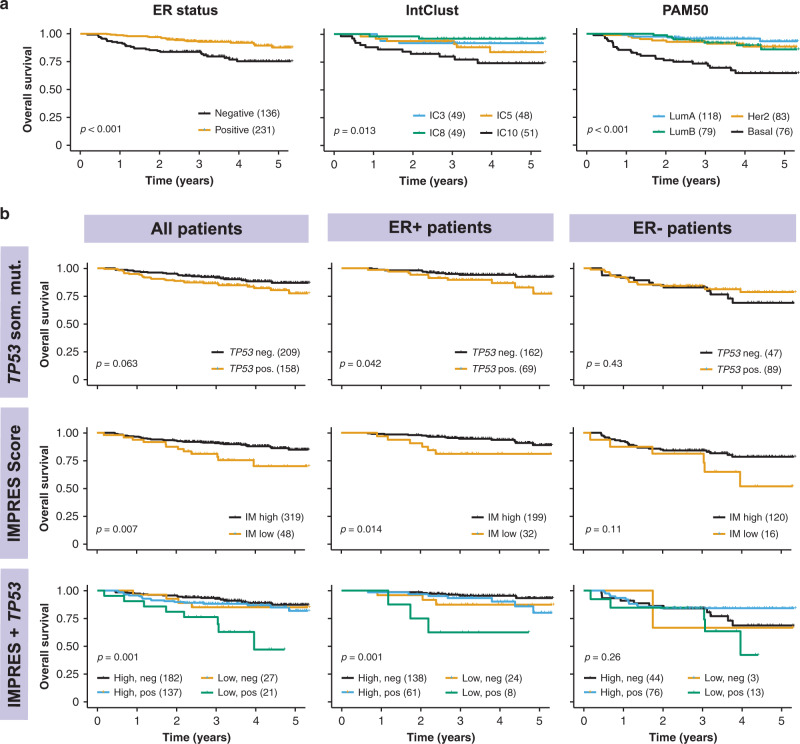
Fig. 5. Survival analyses of MyBrCa patients.
a 5-year overall survival of MyBrCa patients stratified according to ER status (left), the four most common Integrative Clusters (middle), or PAM50 subtype (right). b 5-year overall survival of MyBrCa patients stratified according to presence (TP53 Pos.) or absence (TP53 Neg.) of TP53 somatic mutations (top), tumour IMPRES score (“IM High” = 9 or more, “IM Low” = 8 or less; middle), or a combined analysis of IMPRES score and TP53 somatic mutations (bottom). Results are shown for all patients (left), as well as for only ER+ patients (middle), or ER− patients (right). For all figures, only patients with more than 2 years of follow-up data were included. Brackets in the figure legends indicate sample size for each group, and p values shown are for unadjusted log-rank tests. Crosses indicate patient dropouts.

