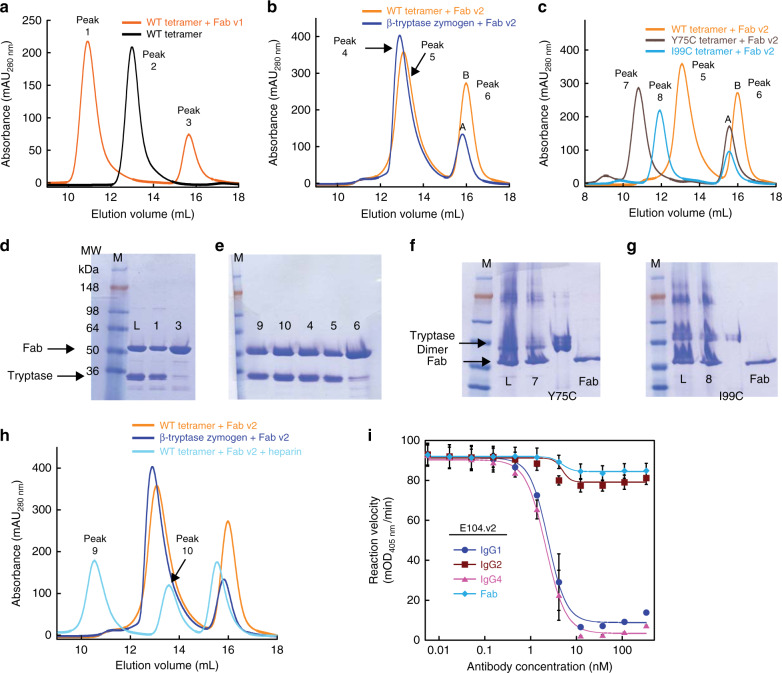
Fig. 3. Complex formation and SEC of βI-tryptase WT and mutants Y75C and I99C in complex with Fabs E104.v1 or E104.v2 in the absence and presence of heparin (100 µg/mL).
a SEC of βI-tryptase tetramer alone (black) and in complex with excess E104.v1 Fab (orange). b SEC of βI-tryptase tetramer in complex with E104.v2 Fab without heparin (orange) and zymogen monomeric βI-tryptase in complex with Fab E104.v2 (blue). c SEC of E104.v2 Fab in complex with WT (orange) and mutant βI-tryptase tetramers Y75C (brown) and I99C (light blue). Elution volumes of the marked peaks 1–8 were: Peak 1 = 10.8 mL, Peak 2 = 13 mL, Peak 3 = 15.8 mL, Peak 4 = 13 mL, Peak 5 = 13.1 mL, Peak 6 = 15.8 mL, Peak 7 = 10.8 mL, Peak 8 = 11.9 mL, Peak 9 = 10.5 mL, Peak 10 = 13.6 mL. Peaks 6A and 6B have elution volumes of 15.6 and 15.8 mL, respectively, and represent excess Fab. d–g SDS-PAGE analysis from the middle of the peaks 1 through 10. M, L and numbers 1 through 10 refer to Markers, Load and Peaks 1 through 10. h SEC of βI-tryptase tetramer in complex with Fab E104.v2 with (cyan) and without heparin (orange) and zymogen monomeric βI-tryptase in complex with Fab E104.v2 (blue). Gels show representative results from two independent experiments. i Concentration-dependent inhibition of βI-tryptase enzymatic activity in the presence of heparin by E104.v2 as IgG1, IgG2, IgG4 and Fab. Data is represented as mean ± s.d. (n = 3 biologically independent experiments). Graphs were created using Kaleidagraph v4.1.3. Source data are provided as a Source Data file.

