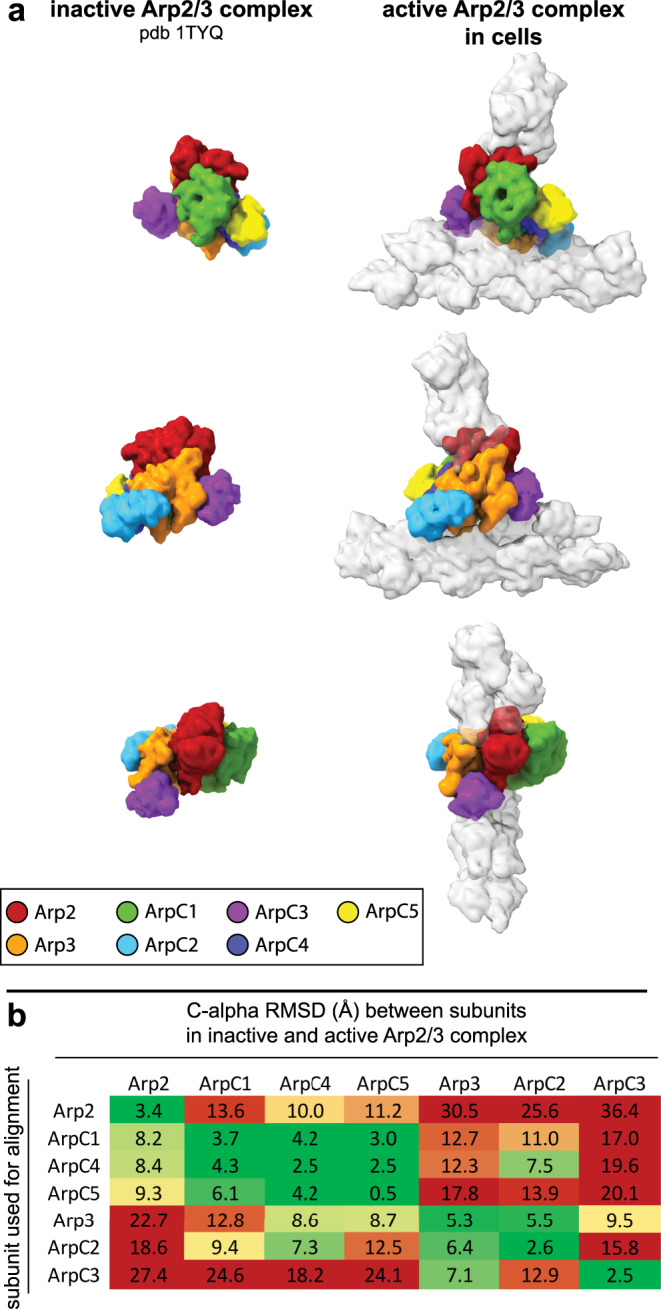
Fig. 2. Comparison of Arp2/3 complex in its inactive conformation and in the branch junction in cells.

a Molecular models of the Arp2/3 complex in the inactive (derived from pdb 1TYQ) and the active conformation shown as density maps filtered to 9.5 Å resolution. The models are shown from three orientations, corresponding to the views in Fig. 1. Subunit colors are annotated in the figure with Arp2 being red, Arp3 orange, ArpC1 green, ArpC2 light blue, ArpC3 violet, ArpC4 dark blue, and ArpC5 yellow. Actin is shown in gray. b RMSD values (in Å) calculated between the inactive and active conformations of the individual Arp2/3 subunits (based on the models used in a). Rows indicate which subunit was used for aligning the full models against each other, prior to measurements between individual subunits of the inactive and active Arp2/3 complexes (indicated in the columns). The RMSD analysis reveals that the structural transition upon complex activation is accommodated by two subcomplexes consisting of Arp2, ArpC1, ArpC4 and ArpC5 and Arp3, ArpC2 and ArpC3, respectively, that rotate against each other along an axis formed by the large helices of ArpC2 and ArpC4 (Supplementary Movie 4). RMSD variations between the same subunits in the inactive and active conformations derive from changes upon MD-based modeling of the x-ray crystal structure-derived model into the electron microscopy density map of the branch junction.
