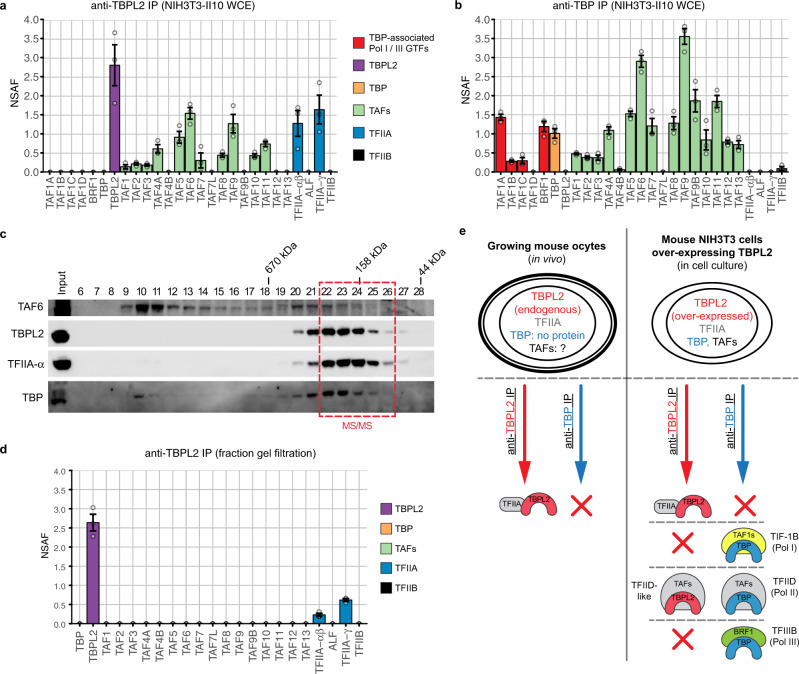
Fig. 2. TBPL2 assembles into a TBPL2/TFIIA and TFIID-like complexes in NIH3T3 cells overexpressing TBPL2.
a Anti-TBPL2 immunoprecipitation followed by mass spectrometry (IP-MS) analysis (three technical replicates) of NIH3T3 overexpressing TBPL2 (NIH3T3-II10) whole-cell extracts (WCE). The colour code for the different proteins or complexes is indicated on the right. b Anti-TBP IP-MS analysis (three technical replicates) of NIH3T3-II10 WCE. Colour legend for the different proteins is the same as in (a). c Western blot of a Superose 6 gel filtration analysis of NIH3T3-II10 WCE probed with anti-TAF6 (top panel), anti-TBPL2 and anti-TFIIA-α (middle panels) and anti-TBP (bottom panel) antibodies. Fraction numbers are shown above each lane, and the elution of known molecular mass markers is indicated above the panels. The pooled fractions used for mass spectrometry analysis are indicated in red. d Anti-TBPL2 IP-MS analysis (three technical replicates) of the gel filtration fraction indicated in (c). The colour code for the different proteins or complexes is indicated on the right. NSAF normalised spectral abundance factor. e Schematic representation of the fundamental differences existing between TBPL2- and TBP-containing complexes in growing oocytes and NIH3T3-II10 cells. In (a, b, and d) grey dots indicate replicates and error bars, +/− standard error of the mean.

