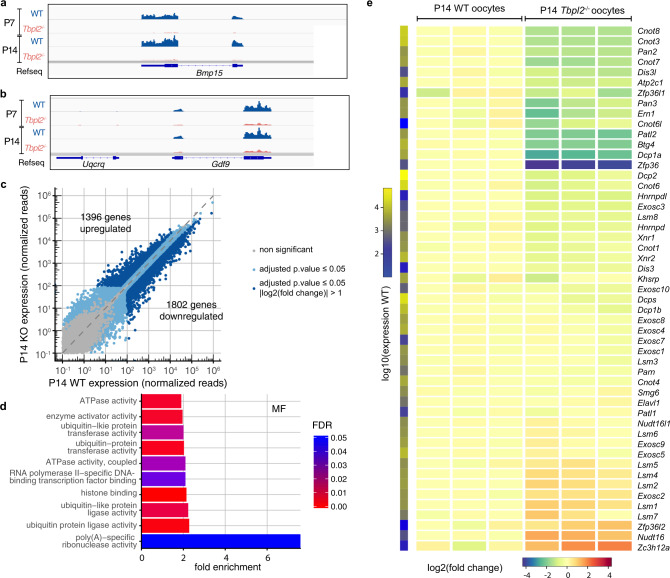
Fig. 3. Expression of genes related to the mRNA deadenylation/decapping/decay pathways in growing Tbpl2−/− mutant oocytes.
a, b Normalised Integrative Genomic Viewer (IGV) snapshots of Bmp15 (a) and Gdf9 (b) loci. Exons and introns are indicated. c Expression comparison between wild-type (WT) and Tbpl2−/− mutant postnatal day 14 (P14) oocytes (biological triplicates). Expression was normalised to the median size of the transcripts in kb. Grey dots correspond to non-significant genes and genes with high Cook’s distance, light-blue dots to significant genes for an adjusted P value ≤ 0.05 and dark-blue dots to significant genes for an adjusted P value ≤ 0.05 and an absolute log2 fold change > 1, after two-sided Wald test and Benjamini–Hochberg correction for multiple comparisons. The number of up- or downregulated genes is indicated on the graph. d Downregulated genes GO category analyses for the molecular functions (MF). The top ten most enriched significant GO categories for a FDR ≤ 0.05 are represented. e Heatmap of selected genes involved in mRNA decay, decapping or deadenylation pathways. Expression levels in fold change (compared to the mean of WT) of three biological replicates of P14 WT and P14 Tbpl2−/− mutant oocytes are indicated. The fold change colour legend is indicated at the bottom. The first column on the left corresponds to the log10 of expression, scale on the left.

