
Fig 3. Liver tumor-associated distant CD8+ T cell dysfunction is antigen-specific and dependent on Tregs.
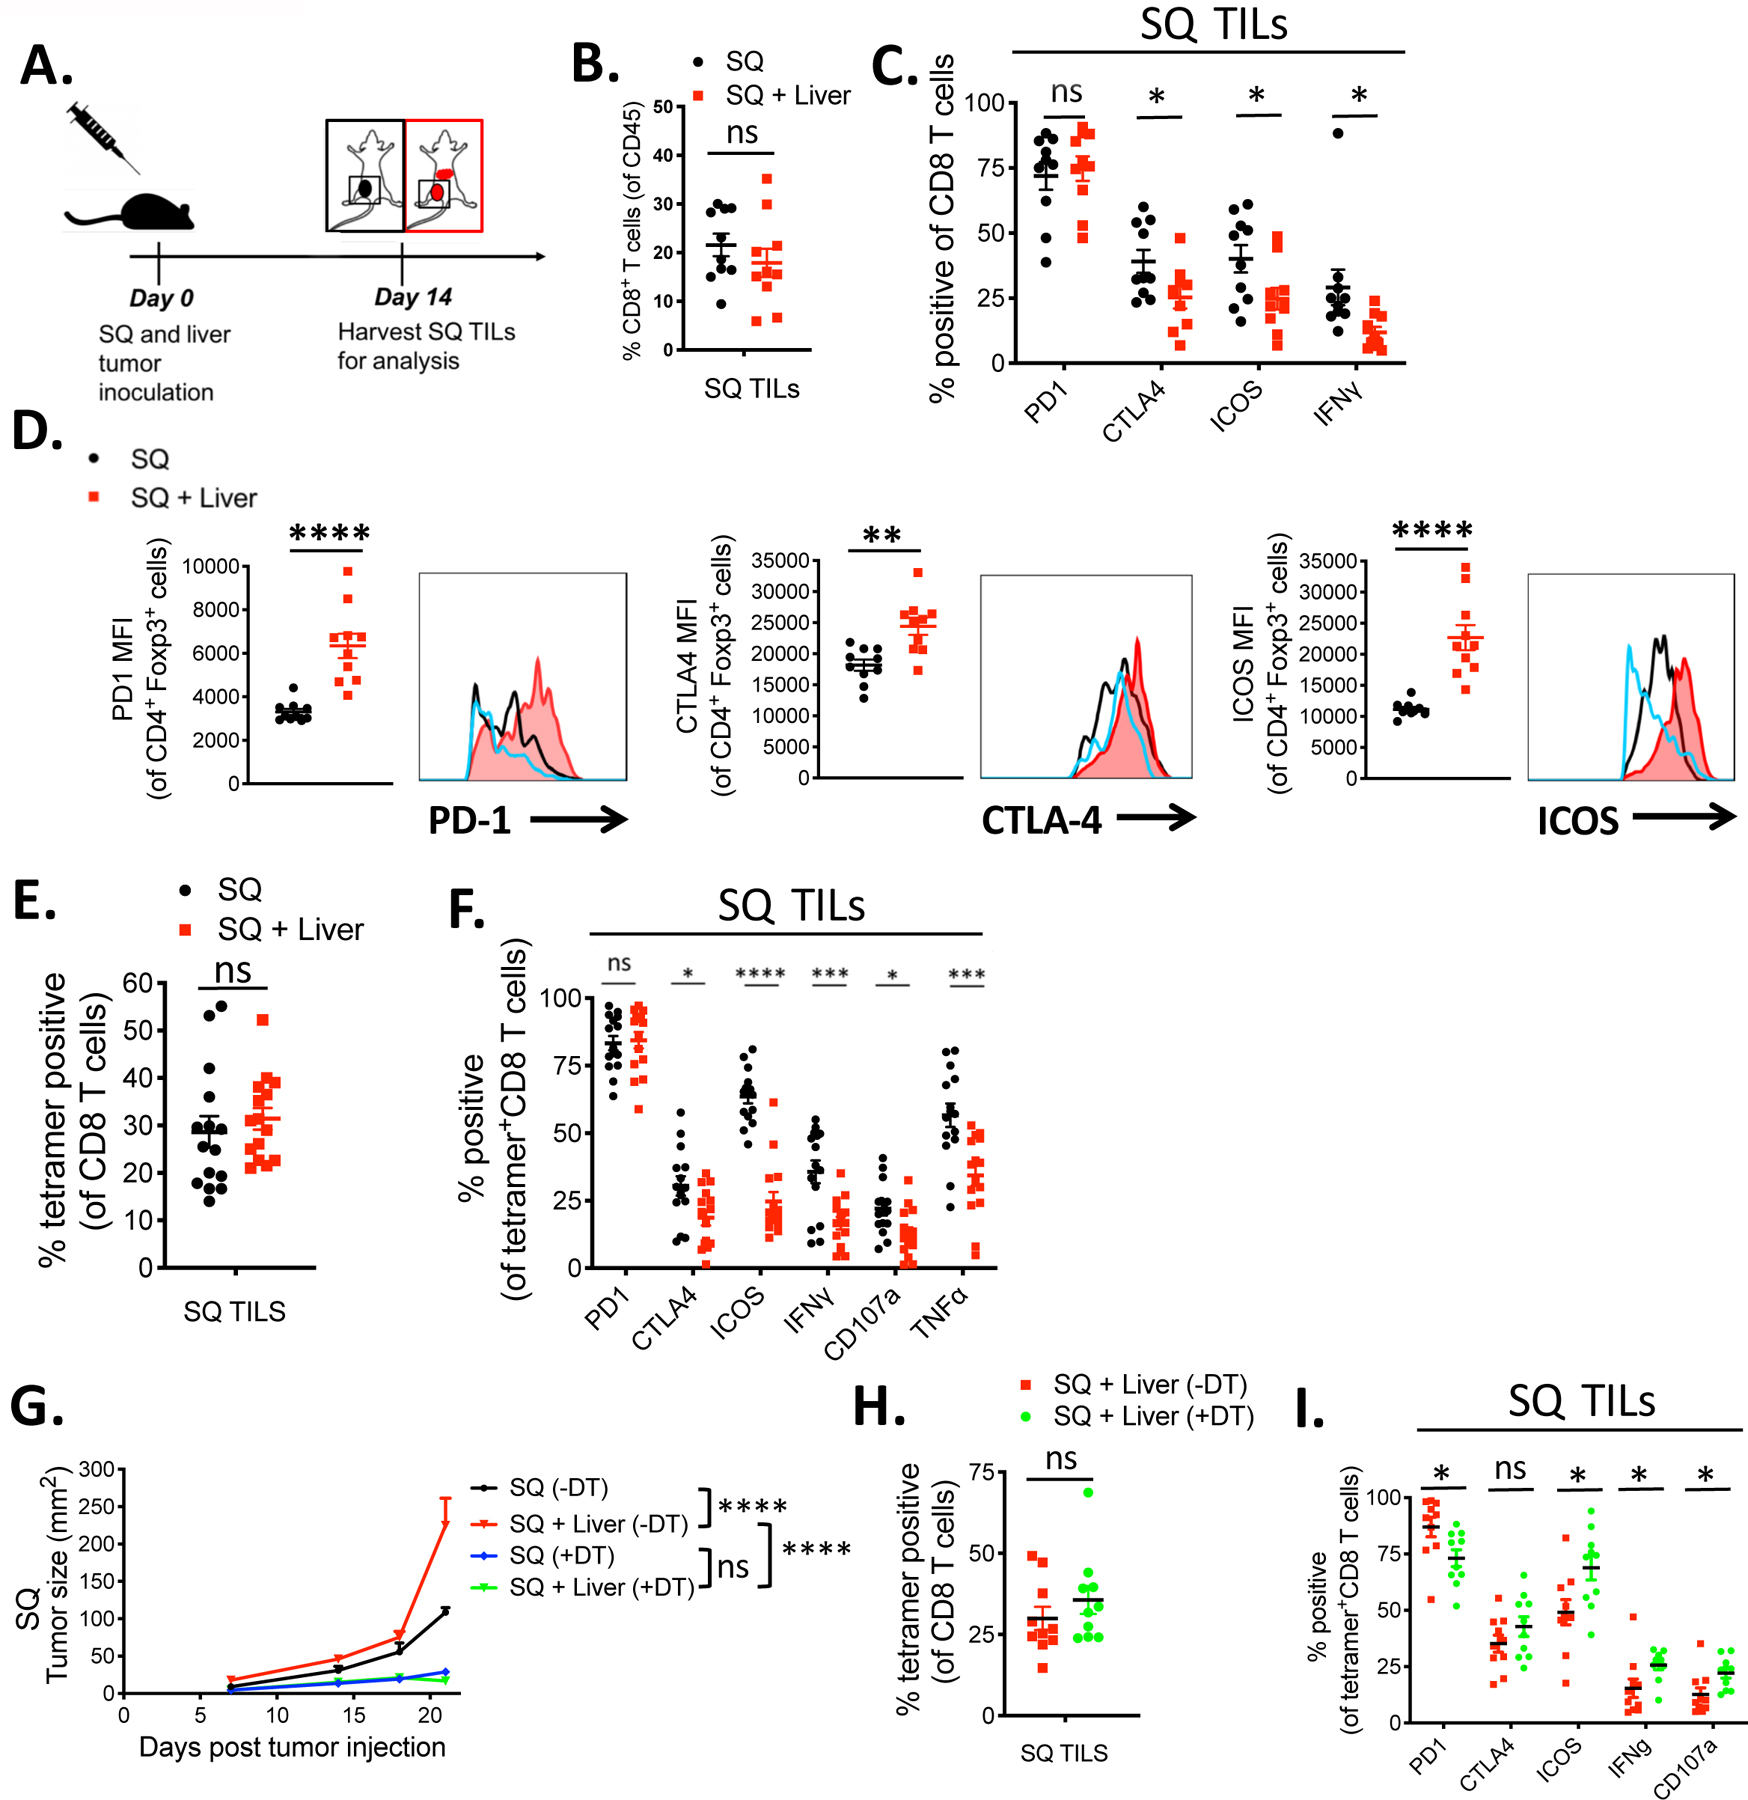
(A) Tumor model schema. C57BL/6 mice were implanted with MC38 tumor cells (5 × 10⁵) subcutaneously alone (black) or subcutaneously plus in the liver (red) and TILs were harvested on day 14 post tumor implantation. (B) Percentage of CD8+ T cells of viable CD45+ immune cells and (C) percentage of CD8+ T cells that express PD-1, CTLA-4, ICOS, and IFNγ in the subcutaneous (SQ) tumor of mice with (red) or without (black) concurrent liver tumor by flow cytometry. (D) PD-1, CTLA-4, and ICOS MFIs from Foxp3+ CD4+ Tregs in the SQ tumor from mice with (red) and without (black) concurrent liver tumor and naïve CD4 T cells (blue). (E) Percentage of tetramer+ (KSPWFTTL) cells of total CD8 T cells in the SQ tumor of mice with or without concurrent liver tumor. (F) Percentage of tetramer+ CD8+ T cells positive for PD-1, CTLA-4, ICOS, IFNγ, CD107a, and TNFα. (Unpaired t tests, * p<0.05, **p<0.01, ***p<0.001, and ****p<0.0001) (G) SQ tumor growth curves of mice with SQ tumor without DT (black ), SQ and liver tumor without DT (red ), SQ tumor with DT (blue), and SQ and liver tumor with DT (green). (H) Percentage of tetramer+ CD8+ T cells and (I) percentage of tetramer+ CD8+ T cells that are positive for PD-1, CTLA-4, ICOS, IFNγ, and CD107a in mice bearing liver tumor with (green) or without (red) DT administration. Data shown as mean +/− s.e.m., (n=15 for E, n=10 for all others). For tumor growth curves, asterisks indicating significance up till day 23 post tumor injection were determined by two-way ANOVA with Sidak’s multiple comparisons test are * p<0.05, **p<0.01, ***p<0.001, and ****p<0.0001. Data were pooled from 2 or more experiments.