
Fig 4. Treg targeting immunotherapy enhances efficacy and reverses immune dysfunction in liver metastasis.
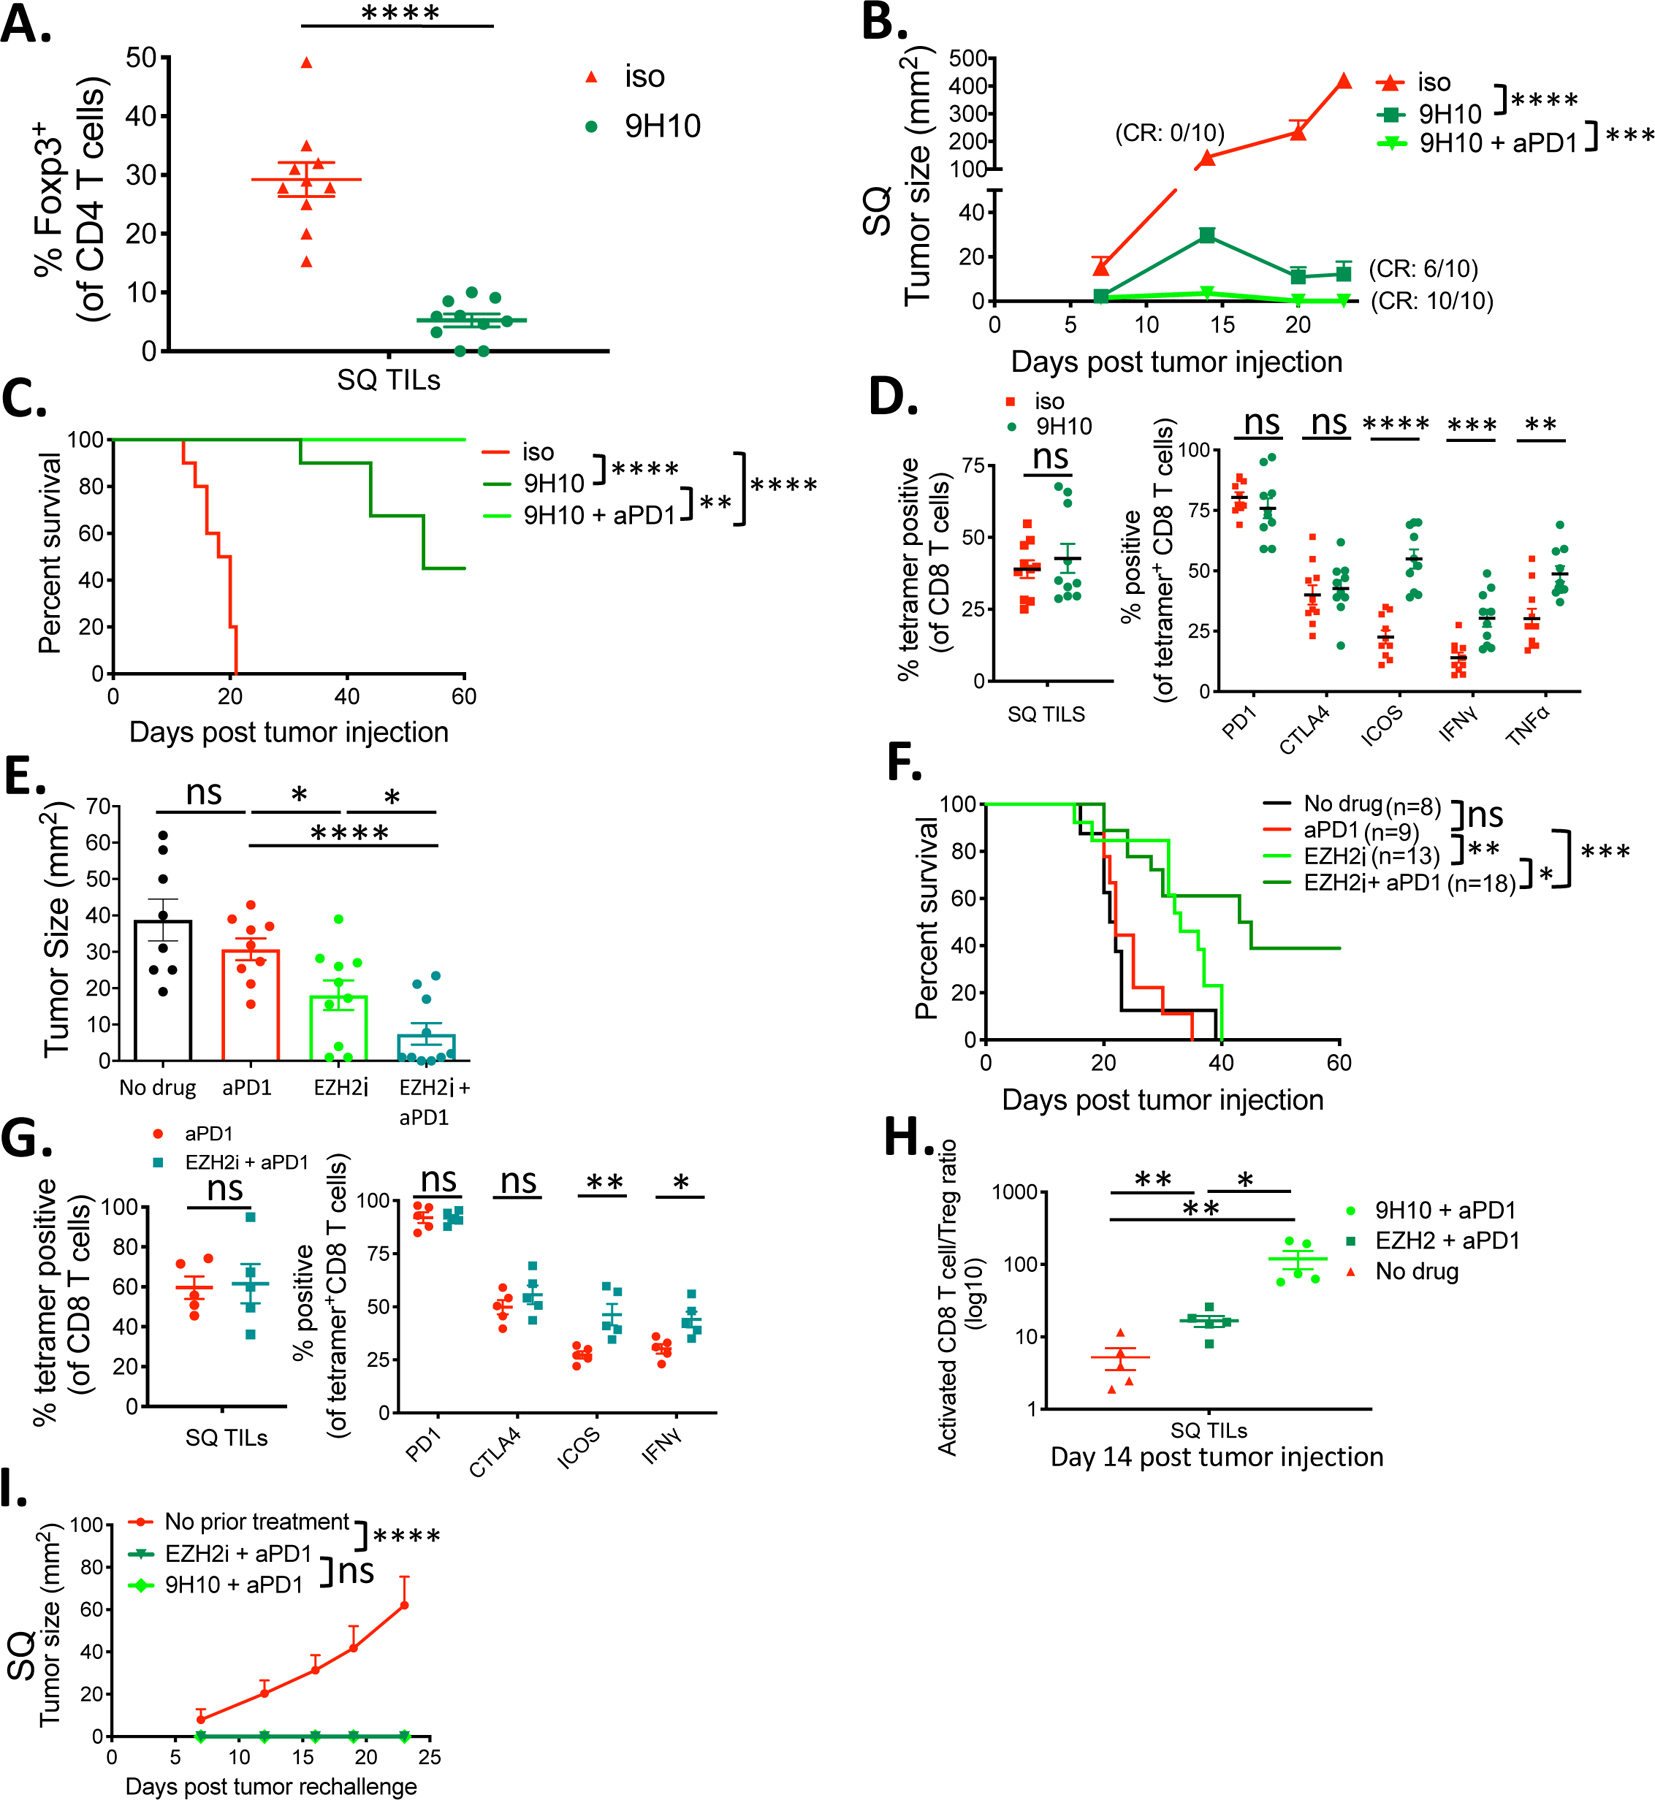
(A) Percentage of Foxp3+ CD4 Tregs within the indicated Subcutaneous (SQ) tumors. (B) SQ tumor growth curves of liver-tumor mice treated with anti-CTLA-4 antibody clone 9H10, 9H10 plus anti-PD-1 antibody, or isotype control. CR= complete rejection with no measurable SQ tumor at endpoint. (C) Survival curves of indicated groups. (D) Percentage of KSP tetramer+ CD8+ TILs and percentage that are positive for PD-1, CTLA-4, ICOS, IFNγ, and TNFα in mice treated with 9H10 versus control. (E) Day 14 SQ tumor sizes from liver-tumor bearing mice treated with EZH2 inhibitor CPI-1205(n=10), anti-PD-1 antibody (n=9), or a combination of both (n=10) compared to control (n=8). (F) Survival curves of indicated groups. (G) Percentage of KSP tetramer+ CD8+ TILs and percentage that are positive for PD-1, CTLA-4, ICOS, and IFNγ in mice treated with anti-PD-1 plus CPI-1205 versus anti-PD-1 alone. (H) Activated CD8+ T cell to Treg ratio within the SQ tumor sample of the indicated treatment groups. (I) SQ tumor growth curves from the MC38 tumor rechallenge experiment of the indicated groups. All data are shown as mean +/− s.e.m. All experiments besides E and F were n=5 or 10 and were representative of three or more independent experiments. Survival curves were analyzed by Log-rank tests, tumor growth curves were analyzed by two-way ANOVA with Sidak’s multiple comparisons, all others were analyzed by unpaired t tests. Asterisks indicating significance determined between groups are * p<0.05, **p<0.01, ***p<0.001, and ****p<0.0001.