
Fig 6. Treg control of distant tumor-antigen specific immunity is mediated by tolerogenic MDSCs.
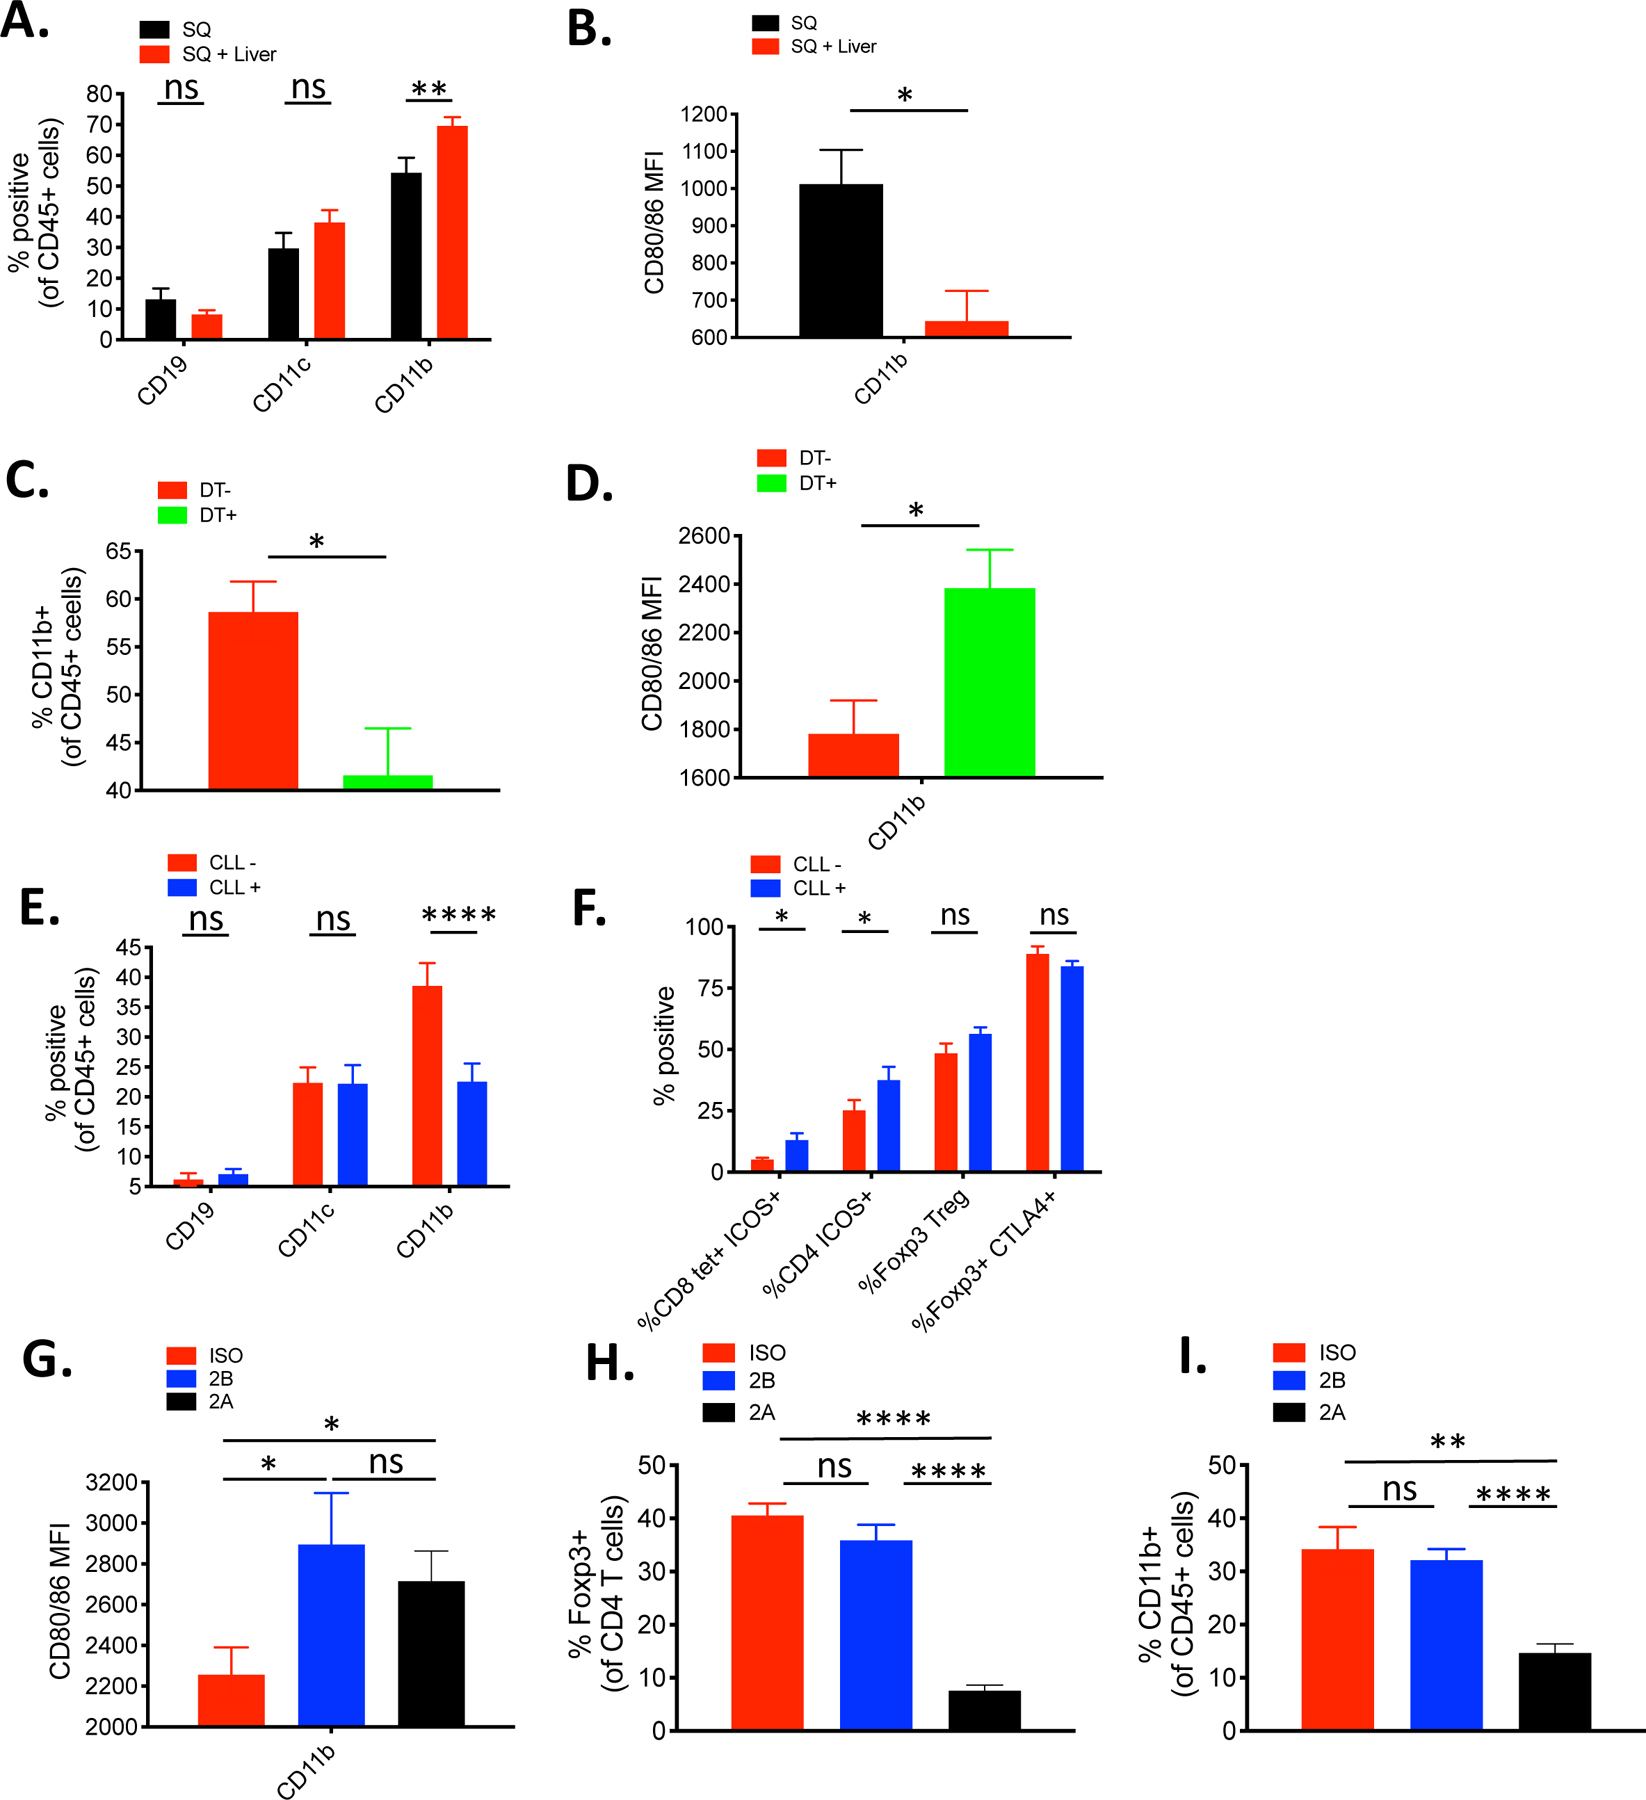
(A) Percentage of CD19, CD11b, and CD11c positive cells in the subcutaneous (SQ) tumor of mice with (red, n=10) or without (black, n=7) concurrent liver tumor by flow cytometry (B) MFI of CD80/86 from CD11b+ cells in the SQ tumor from mice with and without concurrent liver tumor by flow cytometry (each n=7). (C) Percentage of CD11b+ cells in the SQ tumor of Foxp3-DTR mice bearing liver tumor with (green) or without (red) DT administration (each n=8). (D) MFI of CD80/86 from CD11b+ cells in the SQ tumor of Foxp3-DTR mice bearing liver tumor with (green) or without (red) DT administration (each n=8). (E) Percentage of CD19, CD11b, and CD11c positive cells in the SQ tumor of liver-tumor bearing mice treated with liposomal clodronate (CLL) (blue, n=10) or vehicle control (red, n=8). (F) Comparative percentage of tetramer+ ICOS+ CD8+ T cells, ICOS+ CD4+ T cells, Tregs, and CTLA-4+ Tregs in the SQ tumor of mice bearing liver tumor treated with CLL (n=10) or vehicle control (n=8). (G) MFI of CD80/86 from CD45+ CD11b+ cells in the SQ tumor of mice bearing liver tumor treated with isotype control (red), 9D9 IgG2a (blue), or 9D9 IgG2b (black). (H) Percentage of Foxp3+ CD4 Tregs within the SQ tumor of the indicated groups. (I) Percentage of CD45+ CD11b+ cells within SQ tumor of the indicated groups. (G-I) N=6 for all groups. Data representative from at least 2 independent experiments. Data analyzed by unpaired t tests, and shown as mean +/− s.e.m. Asterisks indicating significance determined between groups are * p<0.05, **p<0.01, ***p<0.001, and ****p<0.0001.