Fig. 4.
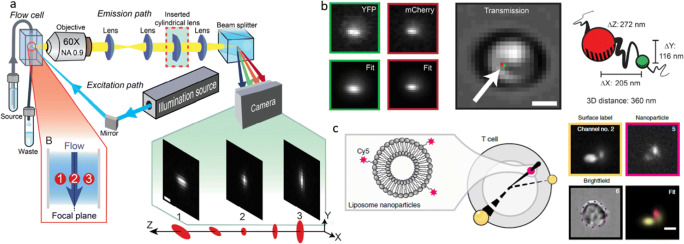
Imaging flow cytometry with PSF engineering. a Flow imaging setup, incorporating a cylindrical lens to encode depth via astigmatism. b Measuring 3D chromatin compaction in live yeast cells, using a 2-color fluorescent operator-repressor system for DNA labeling. Scale bar: 2 μm. c Localizing liposome nanoparticles (pink spots) in human T lymphocyte. Yellow spots represent surface-adhered fluorescent beads, encoding the 3D spherical cell shape. Scale bar: 5 μm. Figure adapted from Weiss et al. (2020)

