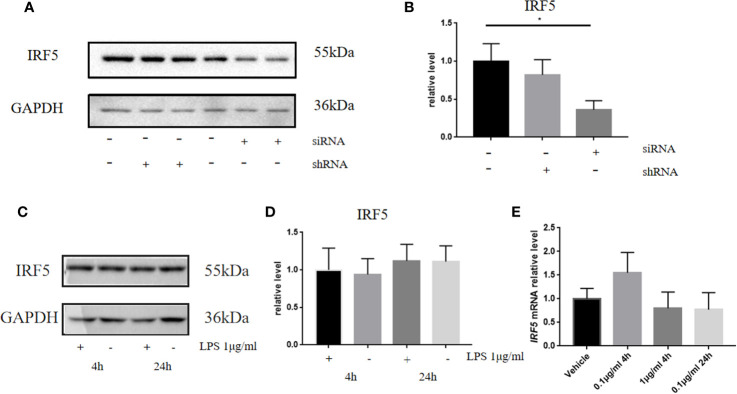
Figure 1.
LPS failed to affect the expression of IRF5 in BV2 microglia. (A) The expression levels of IRF5 in BV2 microglia at 24 h after the transfection of siRNA or shRNA were determined by Western blot. (B) Densitometric quantification of the blots in (A) after being normalized with the GAPDH levels. (C) The expression levels of IRF5 in BV2 microglia at 4 h or 24 h after LPS (1μg/ml) challenge. (D) Densitometric quantification of the blots in (C) after being normalized with the GAPDH levels. (E) The relative levels of IRF5 in BV2 microglia at 4 or 24 h after LPS (0.1 or 1μg/ml) challenge were determined by quantitative real-time PCR. All data is generated from 3 to 4 experimental replicates. *P < 0.05. Values are the mean ± SEM.

