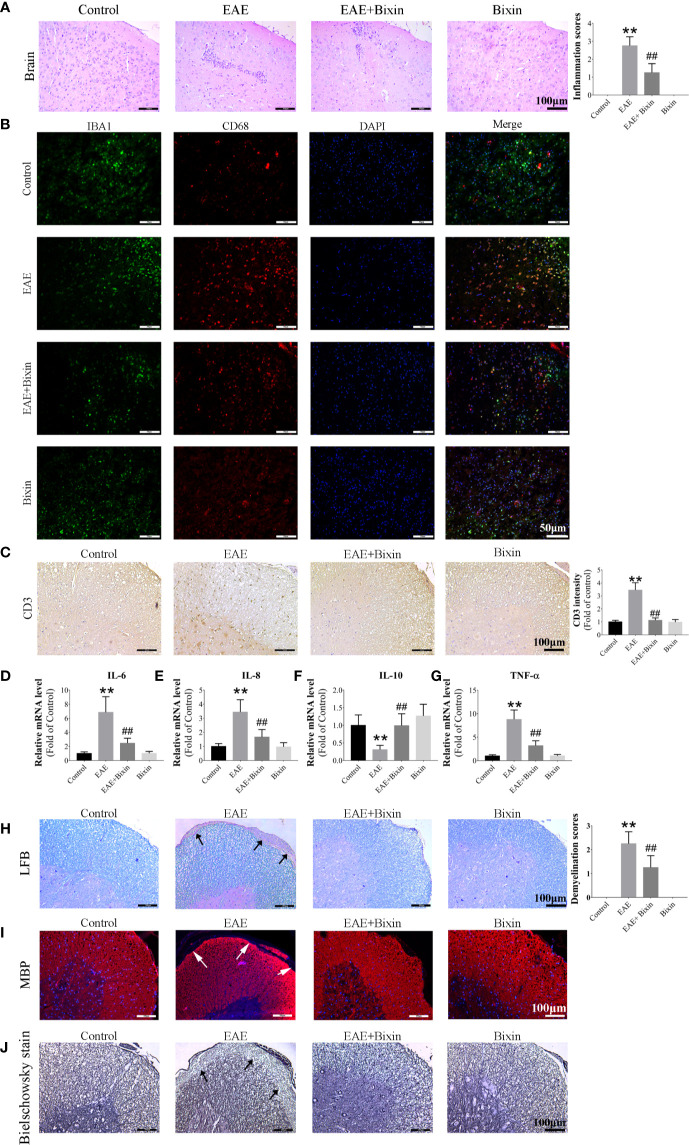
Figure 2.
Bixin reduces the inflammation and demyelination in EAE mice (A). H&E staining showing inflammatory cell infiltration in the brain, as well as the inflammation scores. Scale bars: 100 μm (B). Representative IF images of IBA1 and CD68 in brain sections showing the activated microglia. Scale bars: 50 μm (C). Representative IHC images of CD3+ cells in the spinal cord. Scale bars: 100 μm (D–G). mRNA expression of the inflammatory cytokines IL-6, IL-8, IL-10, and TNF-α were quantitated by qRT-PCR (H). LFB staining showing demyelination in the spinal cord, as well as the demyelination scores. Scale bars: 100 μm (I). IF staining of MBP in the spinal cords. Scale bars: 100 μm (J). Bielschowsky staining showing the degree of axon degeneration. Scale bars: 100 μm. Data shown in graphs represents the means ± SD (n = 5). **P < 0.01, vs. control group; ##P < 0.01, vs. EAE group.

