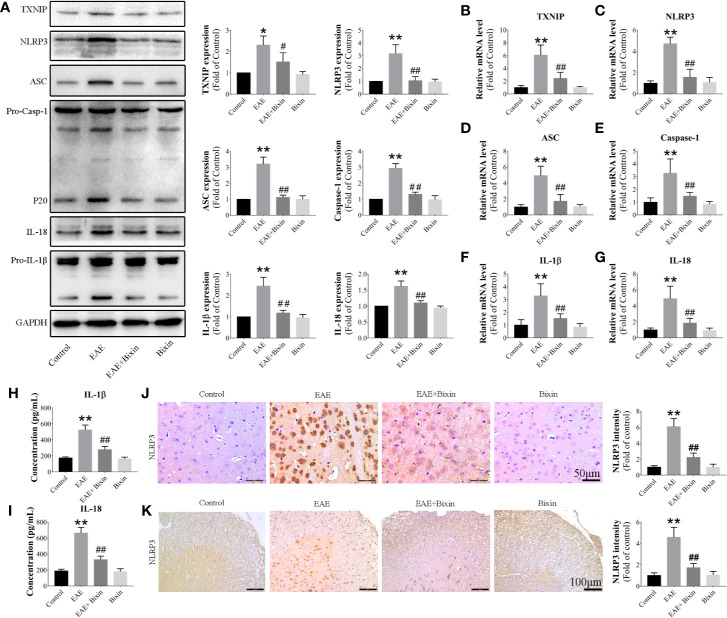
Figure 4.
Bixin suppresses the activation of the TXNIP/NLRP3 inflammasome in EAE mice (A). The protein levels of TXNIP/NLRP3 inflammasome components were assessed by western blotting (B–G). mRNA expression of TXNIP/NLRP3 inflammasome components were quantitated by qRT-PCR (H, I). IL-1β and IL-18 levels in serum were measured by ELISA. Representative IHC images of NLRP3 in brain sections (J) (Scale bars: 50 μm) and spinal cord sections (K) (Scale bars: 100 μm), and the quantitative results are shown. Data shown in graphs represents the means ± SD (n = 5). *P < 0.05, **P < 0.01, vs. control group; #P < 0.05, ##P < 0.01, vs. EAE group.

