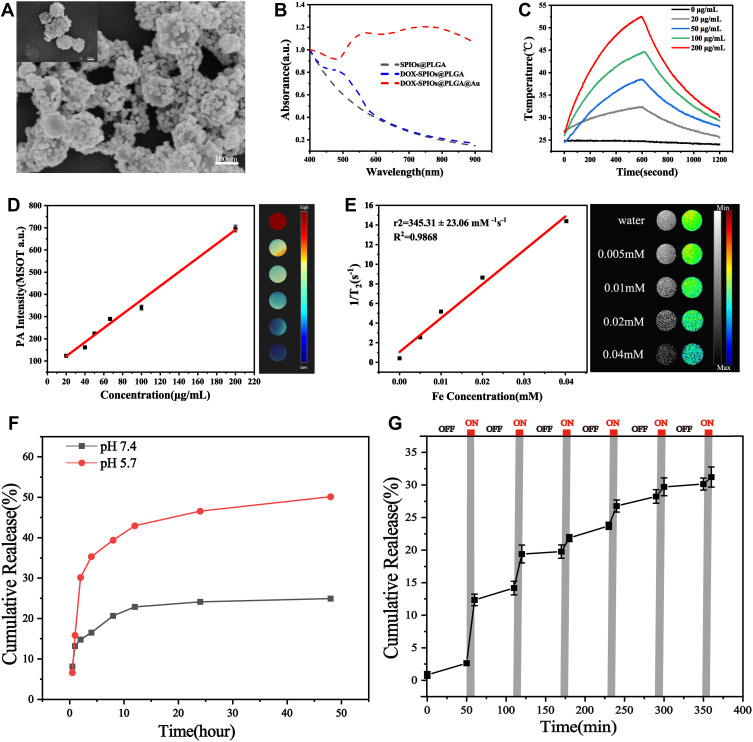
Figure 2.
(A) FESEM images of DSG NPs. (B) UV-vis spectra of the nanoparticle aqueous solution at different stages of preparation process was drawn by the normalization method. (C) The temperature curves of different concentrations of DSG NPs under NIR laser irradiation (808 nm, 1 W/cm2) for 10 min and cooling for 10 min. (D) Measured photoacoustic signal intensity of DSG NPs at various concentrations (data expressed as mean ± SD, n = 4). (E) The relaxation rate and the T2-weighted MRI imaging of DSG NPs was measured by 0.5T analyzer. (F) DOX release profiles from DSG NPs at different pH. (G) DOX release profile from DSG NPs with six cycles of laser on/off (data expressed as mean ± SD, n = 3).

