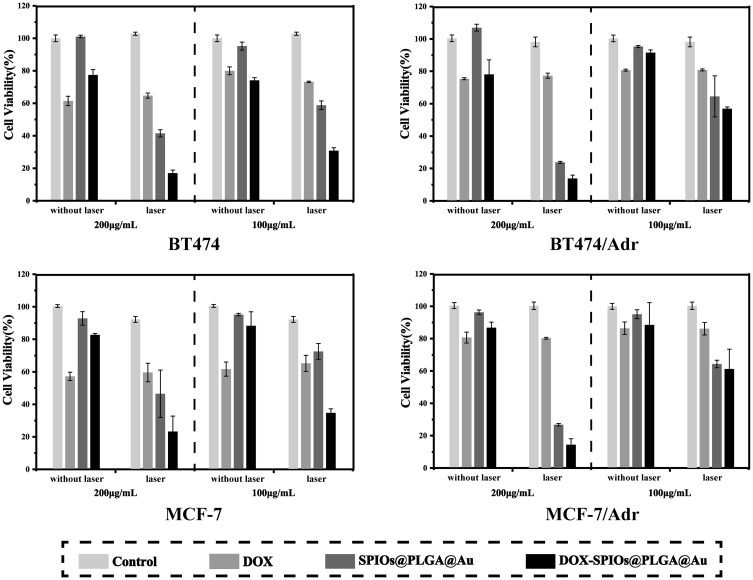
Figure 4.
Cell viability of BT474, BT474/Adr, MCF-7 and MCF-7/Adr cells tested by CCK-8 after being treated in different ways (control, control with laser, SG NPs, SG NPs with laser, DSG NPs, DSG NPs with laser, DOX, DOX with laser; the above groups all had two levels of concentrations: 100 μg/mL, 200 μg/mL), data expressed as mean ± SD, n = 4.

