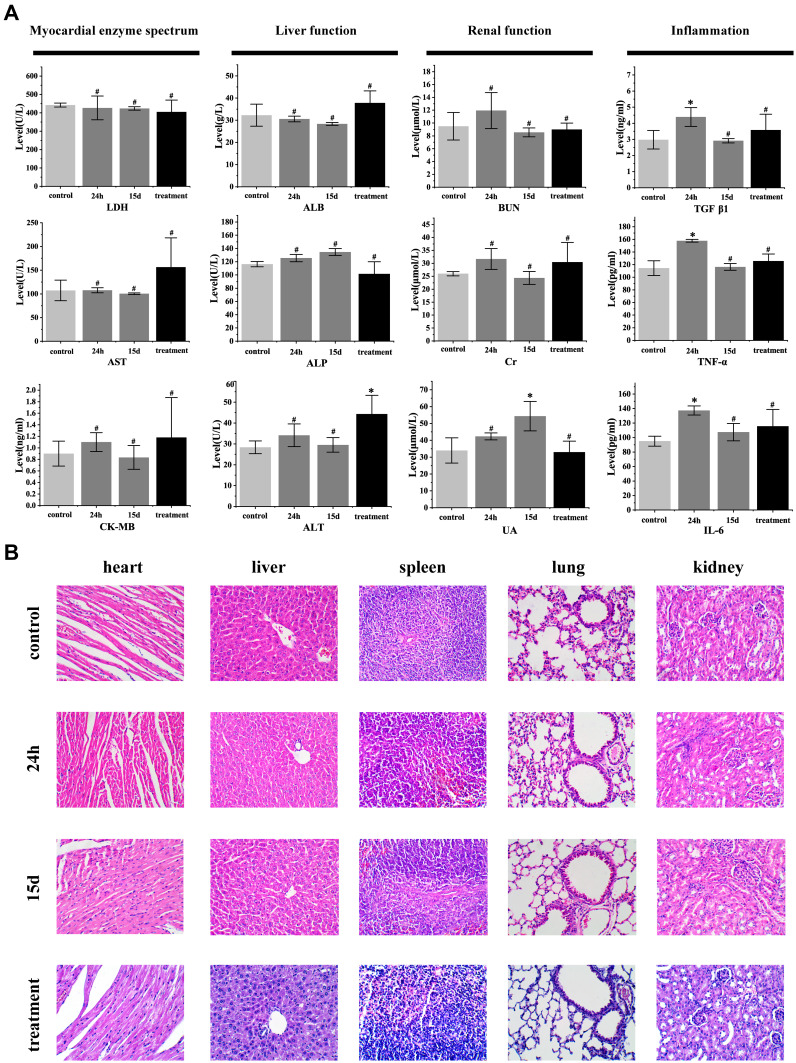
Figure 8.
(A) The blood biochemistry of mice were measured at different times after Her2-DSG NPs (200 μL, 7 mg/mL) intravenous injected, and the blood biochemistry of untreated mice was used as control (data expressed as mean ± SD, n = 3, #P > 0.05, *P < 0.05). (B) Microscope images of H&E stained tissues in various organs (×400 magnification). Treatment group: the mouse samples came from the Her2-DSG NPs with laser group in tumor therapy experiment.

