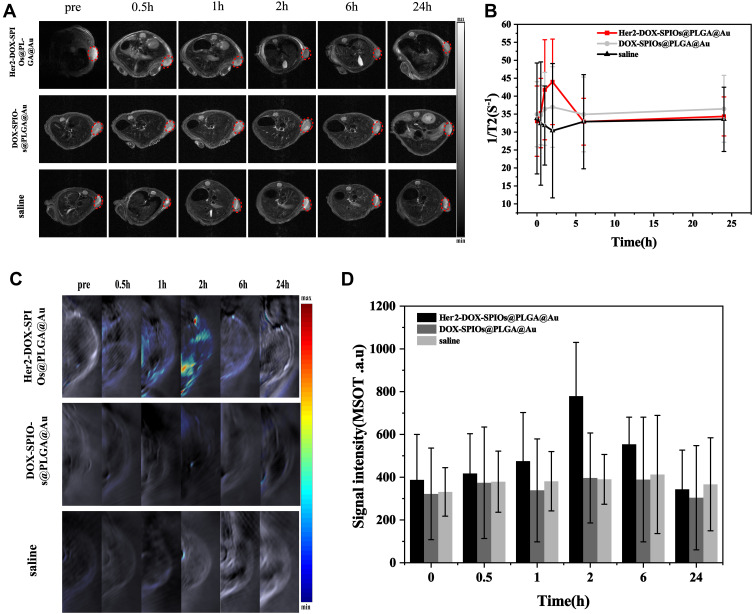
Figure 9.
(A) T2-weighted MR imaging of a BT474 mice xenograft tumor (red dashed circles) at different times (0 h, 0.5 h, 1 h, 2 h, 6 h, 24 h). (B) T2 relaxation rate (1/T2(s−1)) of region of interest (ROI) of tumor at different times. (C) Photoacoustic imaging of a BT474 mice xenograft tumor at different times (0 h, 0.5 h, 1 h, 2 h, 6 h, and 24 h). (D) Signal intensity of ROI of tumor at different times. Data expressed as mean ± SD, n=3.

