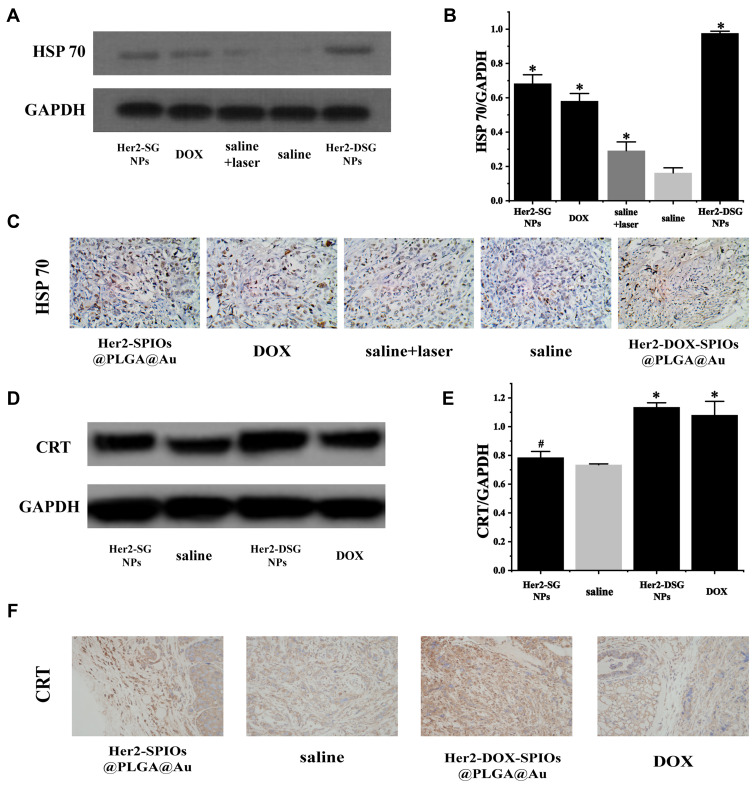
Figure 12.
(A) Expression of HSP 70 in BT474 tumor tissue after various treatments (saline, DOX, saline with laser, Her2-SG NPs, Her2-DSG NPs) through Western blot. (B) The quantitative analysis of Western blot; (C) The immunohistological analysis images of the expression of HSP 70 on tumor tissues (×400 magnification). (D) Expression of CRT in BT474 tumor tissue after various treatments (saline, DOX, Her2-SG NPs, Her2-DSG NPs) through Western blot. (E) The quantitative analysis of Western blot. (F) The immunohistological analysis images of the expression of CRT on tumor tissues (×400 magnification). Data expressed as mean ± SD, n = 3, #p>0.05, *p<0.05. Saline group as control.

