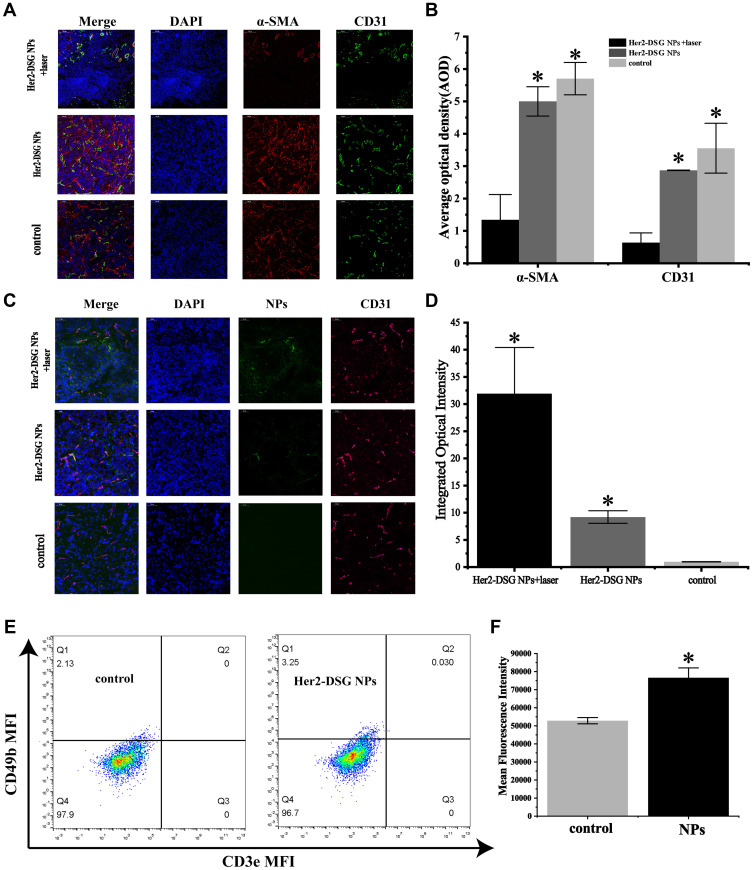
Figure 13.
(A) The CLSM images of the number of CAFs in tumor tissues treated in different ways (Her2-DSG NPs with laser, Her2-DSG NPs, saline; scale bar: 250 μm). (B) The quantitative analysis of average optical density of CD31 and α-SMA was measured by software Image J. (C) The CLSM images of the distribution of nanoparticles in tumor. (D) The quantitative analysis of average optical density of DOX wrapped in nanoparticles was measured by software Image J. (E) Flow cytometry analysis of NK cells in tumor tissues treated in different ways (Her2-DSG NPs, saline). (F) The mean fluorescence intensity of PE. Data expressed as mean ± SD, n = 3, *p<0.05.

