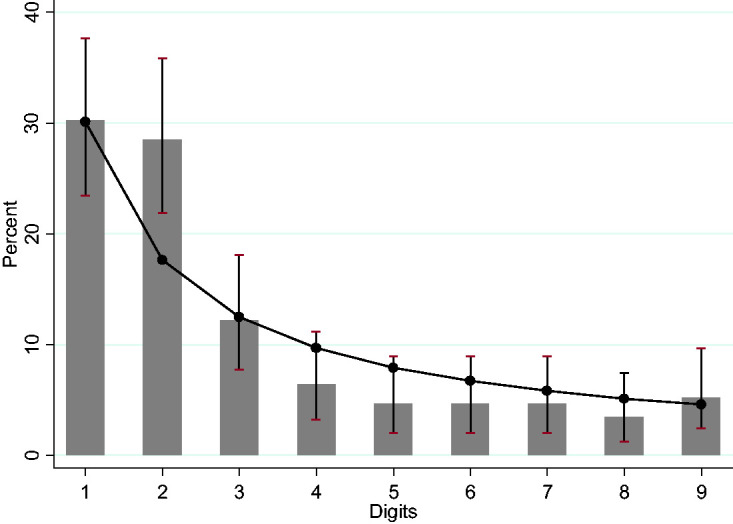
Figure 2.

First-digit frequencies for the Benford distribution of daily reports of cumulated cases in Brazil until August 16, 2020. Bars are the empirical data and markers, with their respective lines, the Benford distribution, and confidence intervals.
