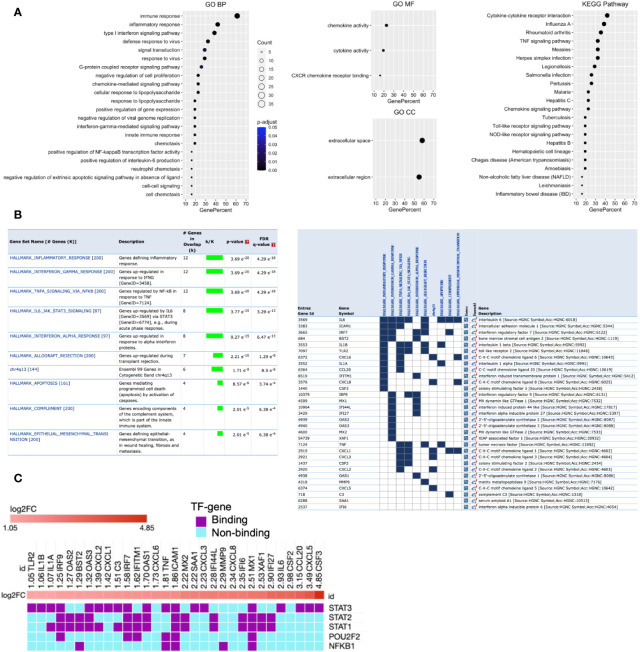
Figure 3.
Functional enrichment of Cluster 1 and its potential upstream regulators. (A) GO and KEGG pathways functional enrichment. (B) MSigDB Hallmark and positional gene sets enrichment. (C) Potential upstream regulators of Cluster 1 genes. Each column indicates the gene of Cluster 1, while each row indicates TF identified by iRegulone. Up-regulated DEHGs in the cluster are red with positive log2FC. TF binding with the mRNA is in purple, while non-binding in cyan.

