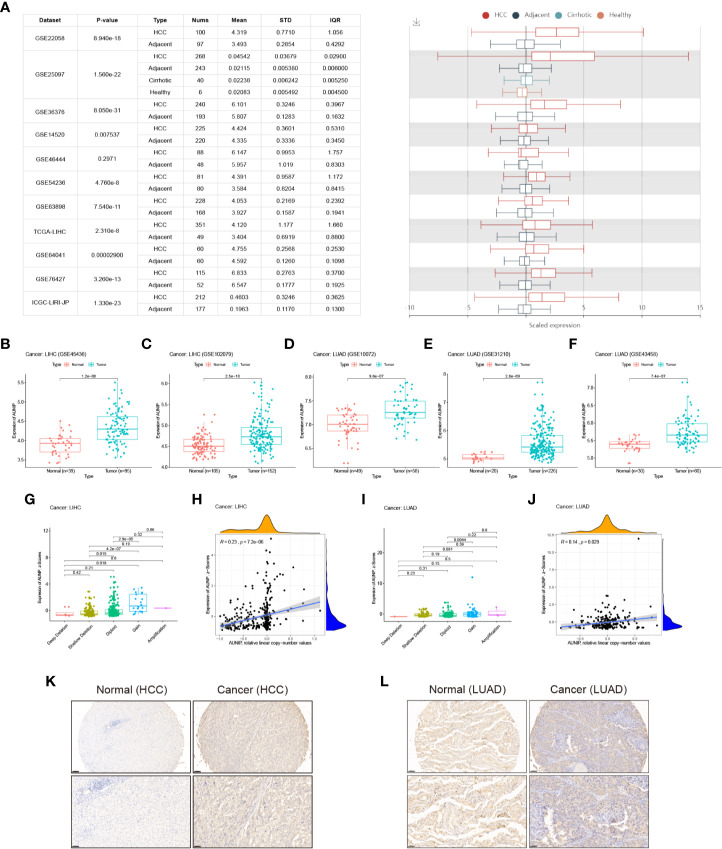
Figure 3.
AUNIP expression in HCC and LUAD. (A) Chart and plot of AUNIP expression in HCC and matched non-carcinoma tissues based on HCCDB data. Box plots of AUNIP expression in HCC and adjacent normal tissues in the (B) GSE45436 and (C) GSE102079 cohorts. Box plots of AUNIP expression in LUAD and adjacent normal tissues in the (D) GSE10072, (E) GSE31210, and (F) GSE43458 cohorts. Dot plot and correlation graph showing the positive correlation between AUNIP expression (z-scores) and AUNIP copy number values in (G, H) HCC and (I, J) LUAD. (K) Representative IHC staining for AUNIP in HCC and normal tissues. Scale bars: 100 μm (insets 50 μm). (L) Representative IHC staining for AUNIP in LUAD and normal tissues. Scale bars: 100 μm (insets 50 μm).

