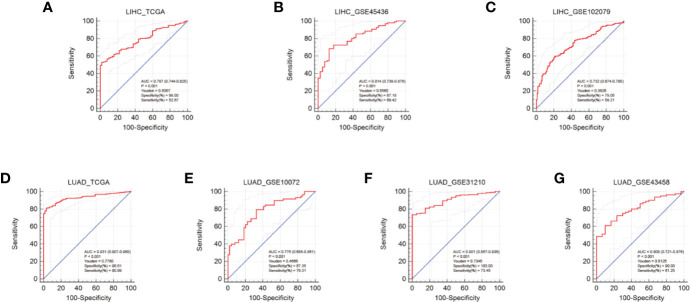
Figure 5.
Diagnostic performance of AUNIP in HCC and LUAD. ROC curves evaluating the diagnostic performance of AUNIP for HCC patients in the (A) TCGA LIHC, (B) GSE45436, and (C) GSE102079 cohorts. ROC curves evaluating the diagnostic performance of AUNIP for LUAD patients in the (D) TCGA LUAD, (E) GSE10072, (F) GSE31210, and (G) GSE43458 cohorts.

