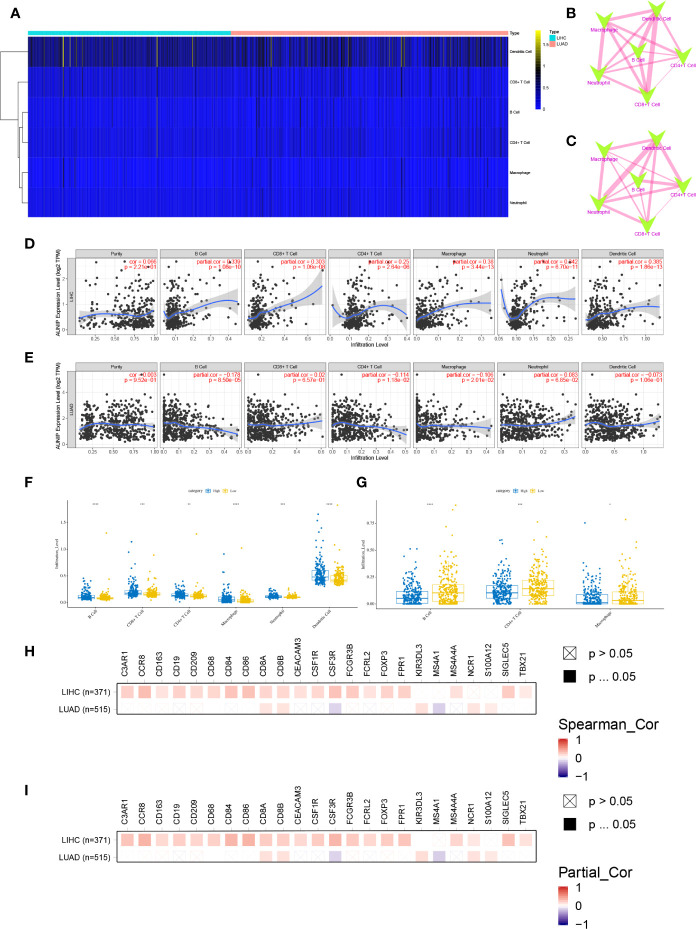
Figure 7.
AUNIP expression is related to the immune infiltration degrees in HCC and LUAD. (A) Heatmap of the abundances of six infiltrating immune cell types in HCC and LUAD. Spearman correlations between immune cell abundances in (B) HCC and (C) LUAD. Blue and red represent negative and positive correlation, respectively, and the thicker the line, the larger the correlation coefficient. Spearman correlations between AUNIP expression and the immune cell abundances in (D) HCC and (E) LUAD. Comparisons of immune cell abundances between the high and low AUNIP expression groups in (F) HCC and (G) LUAD. Spearman correlations between AUNIP expression and markers of B cells, monocytes, neutrophils, CD8+ T cells, natural killer cells, macrophages, Treg cells, Th1 cells, and DCs in HCC and LUAD (H) before and (I) after adjusting for tumor purity. *P < 0.05, **P < 0.01, ***P < 0.001.

